1

enter image description here enter image description here

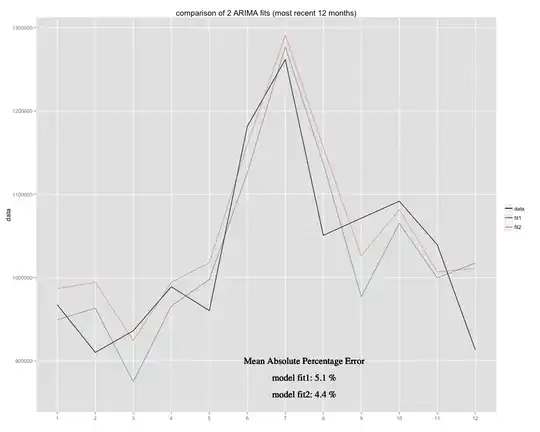
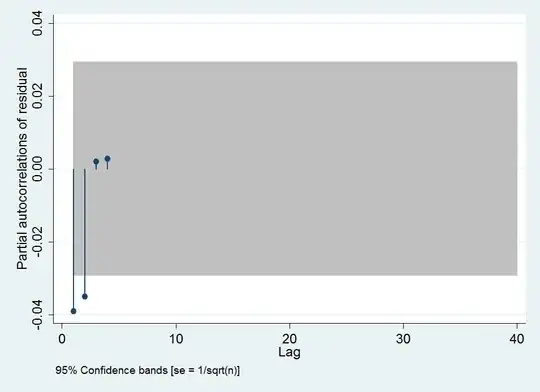
I took the residual of a historical stock price $\hat e_t=r_t-\hat \mu_t$, where $r_t$ is the return of a stock and ran ACF and PACF. From the ACF I think that the residual does not follow AR or MA process, and the PACF shows slight MA. But I am new to this and I am not sure if my interpretation is correct.

What do you think?

The Ljung Box test gave Q-statistic of 87.5597

enter image description here

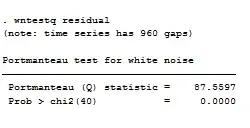
which rejects the null that the autocorrelation coefficients are all zero. I used 40 lags here to be consistent with the ACF and PACF.

Does this contradict or confirm your intuition from visually inspecting ACF and PACF?

user95087
  • 111
  • 1
  • 4
  • 1
    [See](http://stats.stackexchange.com/questions/72285/confusion-about-moving-averagema-process) + [1](http://stats.stackexchange.com/questions/52877/trying-to-fit-a-model-after-detrending) [2](http://stats.stackexchange.com/questions/50151/how-to-tell-if-residuals-are-autocorrelated-from-a-graphic) [3](http://stats.stackexchange.com/questions/59694/autocorrelation-and-partial-autocorrelation-interpretation) [4](http://stats.stackexchange.com/questions/49571/help-understanding-the-following-picture-of-acf) [5](http://stats.stackexchange.com/questions/56824/help-interpreting-acf-and-pacf-plots) – Glen_b Feb 22 '14 at 23:44
  • @Glen_b I just ran a Ljung-Box test (with 10 lags, as per the instructor asked) on STATA and the Q-statistic is 44.9364 which is significant, so I reject the null that all the autocorrelation coefficients are zero, and since 44.9364 is very significant, does that mean the residuals exhibit autocorrelation (at least up to 10 lags)? – user95087 Feb 23 '14 at 00:22
  • Sounds like a different question; comments are not suitable for a series of questions and answers. Modify your question or post a new one. – Glen_b Feb 23 '14 at 00:24
  • I deleted my earlier comment; I had forgotten about the big spike in the AR at lag 7 (the plots are so large you can't look at them both at once - smaller plots are easier to look at simultaneously). – Glen_b Feb 23 '14 at 00:28
  • @Glen_b question updated, with 40 lags – user95087 Feb 23 '14 at 00:29
  • the edit added Ljung box result, so the images are not the same. The ACF and PACF are still the original, of course. – user95087 Feb 23 '14 at 00:35

0 Answers0