1) Beware trying to assess distributional shape from a histogram with only a few bars. On occasion, you can get a misleading impression, especially if sample sizes are small. If sample sizes are big, use far more bars.
2) There are an infinite number of unimodal, slightly right skew distributions. There is no reliable way to discriminate one from any number of others.
3) Real data tends not to follow the simple distributional shapes of the common one-, two- or three- parameter distributions. Real distributions are more like heterogeneous mixtures. Simple distributional forms are convenient fictions (models, to be precise) - they approximate reality in ways that make it easier to work with.
With large samples of real data, it makes sense to work directly with the distribution you have (of which the ecdf is the sample estimate); kernel (or log-spline) density estimates give you nice smooth curves and can help you pick out modes and so on.
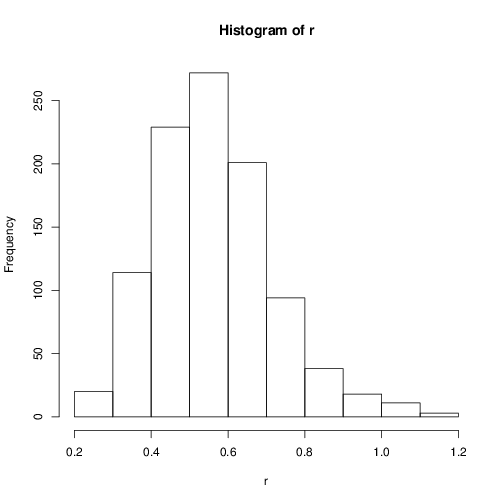
It doesn't seem symmetric around its mean, and it is always nonnegative and unimodal. After its mode, it seems to decay exponentially to infinity, while before its mode, it seems to increase in some different way.
I'd agree.
How, in general, can we guess the distribution from a histogram?
In general, you can't.
Are there some references or summaries for teaching me to do that?
Not really, since you can't really do it without narrowing the problem down (e.g. see my discussion below about how to tell a gamma from a lognormal).
What you can do is simulate many samples from distributions (at each of a number of different sample sizes) to get an idea of what they look like, and how much they can vary.
At first glance it looks like it might kind of be close to a gamma distribution.
But it might be closer to lognormal. (But it might be any of an infinity of other things, as I mentioned)
If those were the only two possibilities and I had to choose between them, I'd look at the distribution of the logs.
When you take logs, what was gamma becomes left-skew:
Lognormals become symmetric (obviously):
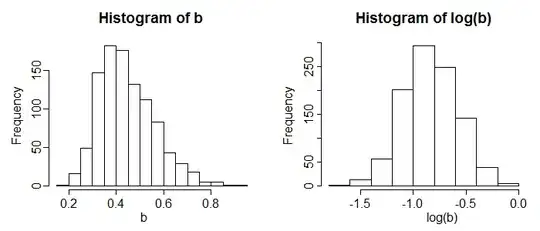
So that's an easy way to distinguish between those two possibilities. If it's still slightly right-skew after you take logs, I'd look at inverse gamma as one possibility.
But once you do that with actual data, don't make the mistake of thinking of your choice as anything more than a model.
(There are a number of posts here that discuss identifying distributions from histograms or Q-Q plots or kernel density estimates that make related points. Some of those are worth looking at.)