My supervisor asked me to find out which distribution represents a particular situation.
I have a VoIP generator that generates calls "uniformly" distributed between callers. This means that the volume per caller distribution is "almost" uniformly distributed between a minimum and maximum. So by running a test with 10000 users and a min value equal to 30 calls per week and a max value equal to 90 calls/week i obtain that not all the users respect this limits: we have some users that generate <30 calls and some other users that generate >90 calls. It is clear that the obtained distribution is not uniform.
The situation is this:
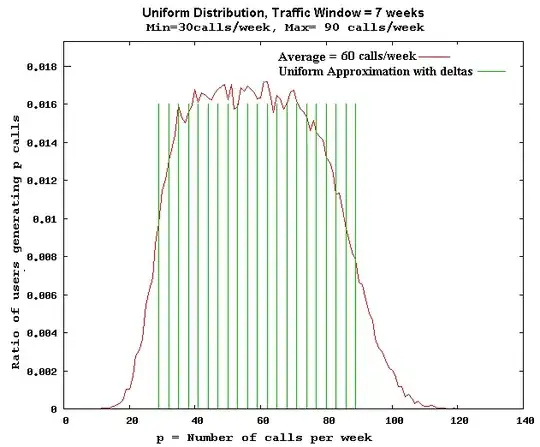
He said that i have to perform a sort of numerical process in order to find some formulas that could define this distribution. Initially, as wrote before,we wanted to obtain a uniform (min,max) distribution (the green area in the figure) but this is not the case as proved with chi-square test. Moreover the curve in figure is not symmetric, the probability of call generation below 30 call/week and greater that 90 call/week are not identical (it is high for 90calls/week). The variability of the number of generated call increases with the increasing call generation rates.
"Actually implementation of this distribution is nothing but assigning different call rates in a range for users in domain which indicates implementation of several delta functions. As the call rates increases the variability of the generated calls also increases with the average call rate and this leads to the asymmetric behavior of the curve." [cit. from the Voipgenerator documentation]
Someone can help me?I think that now i cannot use Q-Q plot because i don't know which theoretical distribution i have to use in order to compare it with my empirical data.
Sorry if I have stressed with a similar problem a few weeks ago, but initially we thought we could change the implementation, but now we cannot. Hence i have to discover the type of the distribution i obtained and i don't know how can i do this.
