5

I have to demonstrate that a generator of VoIP calls generates calls uniformly distributed between callers. In particular the distribution is the uniform (min, max) one where the volume per caller distribution is uniformly distributed between a minimum and maximum. So by running a test with 10000 users and a min value equal to 30 calls per week and a max value equal to 90 calls/week i obtain that not all the users respect this limits.

The situation is depicted in figure:

The few users that generate <30 or >90 calls spoil the chi-square goodness of fit test and I don't know how can i proceed with a goodness of fit test. Most of the values is within the interval (and from these we obtain low chi-square value), but the few out-of-range values spoil the final chi-square calculation.

In your opinion what is the best way to operate? What should I do with the "out-of-range"values? Thank you.

PS: the chi-square goodness-of-fit test performed is reported in the following figure: enter image description here

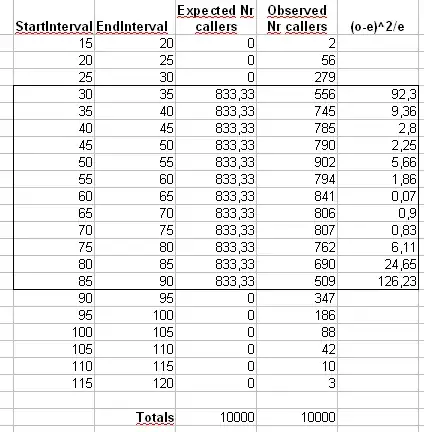
where still I don't know what to do with the out-of-range values.

UPDATE

after talking with people linked with the project we concluded that the generator does not satisfy the uniform distribution. We have to do a theoretic analysis of what we expect really to be the distribution at the end of the generation based on the inputs.

This means that I have to do it! More details: The generator assigns a "probability" between 0 and 1 to the callers (with a particular method, that probably is the problem). Then it generates a random value from 0 to 1 and it finds the associated user and assigns the call to him.

The generator generates calls for a week with the constant rate equal to 1 call per second, this means that it generates ca. 604800 total calls.

My goal is to distribute the callers between the min and max number of calls in a week. For example if I have 10000 users and the min limit is equal to 30 calls per week and max = 90 calls per week I should obtain something about:

30 calls : 163 users.

31 calls : 163 users.

....

90 calls : 163 users.

So 163 users generate 30 calls in a week..etc, etc and finally 163 users generate 90 calls in a week. How should I assign the probability to callers in order that the generator distributes the callers uniformly between the range 30-90?

Maurizio
  • 265
  • 2
  • 9
  • 11
    You have demonstrated the calls are *not* uniformly distributed. The $\chi^2$ calculation is not "spoiled": it worked! – whuber Feb 23 '11 at 16:23
  • ok, mmm..maybe is there a "conceptual" error during the implementation of the generator? because for my thesis, my supervisor asked me to demonstrate formally that the generator (which is the result of months&months of study and they use for a long time) really follows the uniform distribution. Maybe can I use a sort of "approximation"? – Maurizio Feb 23 '11 at 16:35
  • 5
    What would you like to approximate? Obviously you cannot validly demonstrate this generator produces uniform results: the data flatly contradict that. The next step depends on what actions you contemplate. Could the data be wrong? Could they inaccurately reflect what the generator is doing? Could they indicate an unexpected phenomenon? Could the design of the generator be wrong? You need to raise (and eventually address) questions like these. The one question that is definitively settled, though, is the one you originally asked: these data are not uniform! – whuber Feb 23 '11 at 16:45
  • thanks, i think it is better to speak with who has implemented the generator before reaching hasty conclusions. – Maurizio Feb 23 '11 at 16:52
  • new udpate! (and new detailed title) – Maurizio Feb 28 '11 at 15:22
  • @whuber I think you are ignoring the funny way the uniform distribution is defined based on sample values and hence having a random interval to be uniformly distributed on. I think this does mess up the chi square test because if the data is really uniform as i said in my answer for the true interval [A, B] A< sample min and B> sample max. He actually get data in at least one of those intervals outside the range. – Michael R. Chernick May 04 '12 at 20:32
  • I don't see what I'm missing here, @Michael: isn't it obvious these data do not come from a uniform distribution? No formal test is needed. (If you mean the $\chi^2$ result is invalid, please see http://stats.stackexchange.com/questions/1692.) BTW, this old question is superseded at http://stats.stackexchange.com/questions/8446, which still needs a good answer. When addressing older questions, it is advisable to check whether the proposer ever followed up with related questions: raise their summary page by clicking on their name and check out the list of questions that shows up there. – whuber May 04 '12 at 20:55
  • What bothers me about this is the way you specified the problem. You are not testing that the data come from a uniform distribution but rather that if you get the interval from the minimum to the maximum of a random sample that another sample will have a uniform distribution in that interval. It is possible that both the original sample and the followup sample both come from the same uniform distribution on [A,B]. The minimum of your sample will always be >A and the maximum – Michael R. Chernick May 03 '12 at 16:01
  • So explaining to someone that they may be formulating the problem incorrectly deserves a downvote! – Michael R. Chernick May 03 '12 at 18:40
  • It's not always about whether an answer "deserves" a downvote but suggestions for improvement, like the one you've given in the answer, are usually more well suited to being comments. To be sure, this answer does provide some useful information, but it does not answer the question. – Macro May 03 '12 at 19:03
  • The question seems ill-posed to me and hence there is no sensible answer to it. My suggestion is to reformulate it so that a sensible answer can be given. In this case I would identify a fixed intervals where you expect the data to spread uniformly. – Michael R. Chernick May 03 '12 at 20:03
  • 1
    Then the answer would be to apply a goodness of fit test such as the chi square. What people are doing fitting to the data generated interval where data falls into cells outside the range doesn't make sense to me. If you are strict about the interval once you find a single observation outside the interval you can unequivocally reject the hypothesis of uniformity on the interval without any goodness of fit test. – Michael R. Chernick May 03 '12 at 20:03
  • I am voting to open this question since it is different from the referred duplicate. This question involves *"How should I assign the probability to callers in order that the generator distributes the callers uniformly between the range 30-90?"* Which is about finding a compound distribution (one distribution for the probability for callers, another distribution for the assignment of the callers). The second can be modeled by a binomial/Possion distribution. The question is what distribution for the first will make the compound distribution resemble a uniform distribution (as much a possible). – Sextus Empiricus Aug 18 '18 at 13:02

2 Answers2

0

Perhaps you should randomly permute the callers, then, per your example, claim that the first 163 made 30 calls, the next 163 made 31 calls, etc. By 'permutation', I mean sort them in a random order. The simple way to do this is to use your random number generator to assign each caller a number, then sort them by that number.

shabbychef
  • 10,388
  • 7
  • 50
  • 93
-2

What you are describing resembles a "continuous uniform distribution",

http://mathworld.wolfram.com/UniformDistribution.html

-Ralph Winters

Ralph Winters
  • 801
  • 5
  • 7
  • 7
    @Ralph The whole point of the comments following the question is that although the distribution of the data might "resemble" a uniform distribution, it is extremely unlikely that the data were truly obtained from this distribution. That's why we use quantitative methods in statistics: they keep us from fooling ourselves (and others) with suggestive patterns or resemblances that are not justifiable. – whuber Feb 23 '11 at 20:46