I have made this linear regression model:
mtcars_lm <- lm(mpg ~ drat + hp, mtcars)
Using the effects package, I can predict values of mpg for every value of hp between 70 and 150, plus get a confidence interval for each value of mpg:
library(effects)
as.data.frame(effect("hp", mtcars_lm, xlevels = list(hp=seq(70, 150, 10))))

   hp      fit        se    lower    upper
1  70 24.06201 0.9066002 22.20781 25.91622
2  80 23.54415 0.8355302 21.83530 25.25300
3  90 23.02628 0.7691351 21.45322 24.59934
4 100 22.50841 0.7087300 21.05890 23.95793
5 110 21.99055 0.6559716 20.64894 23.33216
6 120 21.47268 0.6128381 20.21929 22.72608
7 130 20.95481 0.5814753 19.76556 22.14407
8 140 20.43695 0.5638509 19.28374 21.59015
9 150 19.91908 0.5612604 18.77118 21.06699
And I can plot the result:
plot(effect("hp", mtcars_lm, xlevels = list(hp=seq(70, 150, 10))))
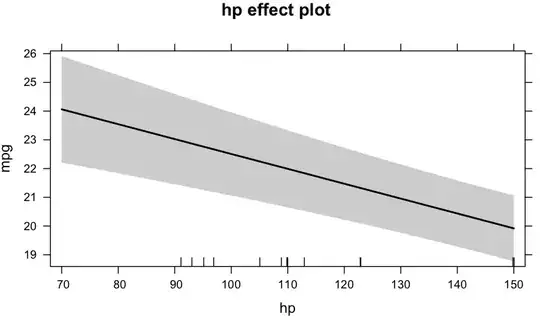
My question is: what is the maths behind the calculation of the standard error and confidence interval for every value of mpg?