I would like to import the "Last Trade" stock price from Yahoo finance into R. The intention is to work with (almost) real time data. Are there any solutions?
Thanks in advance for any helpful comment.
I would like to import the "Last Trade" stock price from Yahoo finance into R. The intention is to work with (almost) real time data. Are there any solutions?
Thanks in advance for any helpful comment.
That is pretty easy given that R can read directly off a given URL. The key is simply to know how to form the URL. Here is a quick and dirty example based on code Dj Padzensky wrote in the late 1990s and which I have been maintaining in the Perl module Yahoo-FinanceQuote (which is of course also on CPAN here) for almost as long.
If you know a little R, the code should be self-explanatory. Getting documentation for the format string is a little trickier but e.g. the Perl module has some.
R> syms <- c("^GSPC", "^IXIC")
R> baseURL <- "http://download.finance.yahoo.com/d/quotes.csvr?e=.csv&f="
R> formatURL <- "snl1d1t1c1p2va2bapomwerr1dyj1x"
R> endURL <- "&s="
R> url <- paste(baseURL, formatURL, endURL, paste(syms, collapse="+"), sep="")
R> read.csv(url, header=FALSE)
     V1                V2      V3        V4     V5 V6    V7
1 ^GSPC S&P 500 INDEX,RTH 1256.88 3/16/2011 4:04pm  0 0.00%
2 ^IXIC  NASDAQ Composite 2616.82 3/16/2011 5:30pm  0 0.00%
          V8 V9 V10 V11     V12     V13               V14
1 4282084608  0 N/A N/A 1256.88 1279.46 1249.05 - 1280.91
2          0  0 N/A N/A 2616.82    0.00       0.00 - 0.00
                V15 V16 V17 V18 V19 V20 V21      V22
1 1010.91 - 1344.07 N/A N/A N/A N/A N/A N/A      SNP
2 2061.14 - 2840.51 N/A N/A N/A N/A N/A N/A NasdaqSC
R>
Column three is your last trade. During open market hours you will get fewer NAs and more data variability. But note though that most prices are 15 or 20 minute delayed---but some indices are real-time. Real-time data is a big business and major revenue for exchanges so they tend not to give it away. Also, and if I remember correctly, the newer and more real-time displays on the Finance pages at Google and Yahoo use something more AJAXy that is harder to milk from the outside.
This really isn't a statistics question (perhaps this could be moved to SO?), but there's a nice function in quantmod that does what Dirk has done by hand. See getQuote() and yahooQF(). Typing yahooQF() will bring up a menu of all the possible quote formats you can use.
> require(quantmod)
> getQuote("QQQQ;SPY", what=yahooQF("Last Trade (Price Only)"))
              Trade Time   Last
QQQQ 2011-03-17 12:33:00  55.14
SPY  2011-03-17 12:33:00 128.17
Here's a little function I wrote to gather and chart "pseudo-real time" data from yahoo:
require(quantmod)
Times <-  NULL
Prices <- NULL
while(1) {

   tryCatch({
      #Load current quote
      Year <- 1970
      currentYear <- as.numeric(format(Sys.time(),'%Y'))
      while (Year != currentYear) { #Sometimes yahoo returns bad quotes
         currentQuote <- getQuote('SPY')
         Year <- as.numeric(format(currentQuote['Trade Time'],'%Y'))
      }

      #Add current quote to the dataset
      if (is.null(Times)) {
         Times <- Sys.time()-15*60 #Quotes are delayed 15 minutes
         Prices <- currentQuote['Last']
      } else {
         Times <- c(Times,Sys.time())
         Prices <- rbind(Prices,currentQuote['Last'])
      }

      #Convert to 1-minute bars
      Data <- xts(Prices,order.by=Times)
      Data <- na.omit(to.minutes(Data,indexAt='endof'))

      #Plot the data when we have enough
      if (nrow(Data)>5) {
         chartSeries(Data,theme='white',TA='addRSI(n=5);addBBands(n=5)')
      }

      #Wait 1 second to avoid overwhelming the server
      Sys.sleep(1)

   #On errors, sleep 10 seconds and hope it goes away
   },error=function(e) {print(e);Sys.sleep(10)})
}
It produces charts like this:
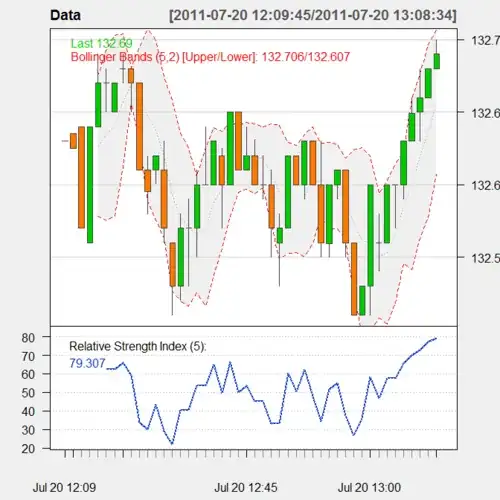
You can also use the data for other purposes.