I have a feature x, that I use to predict a probability y.
Some background on (x,y)
I can't go into too much details, but hopefully the following should be enough to explain what x and y are, at least conceptually [square and circles are NOT the actual label I am working with]:
y
y is the probability of an image being of Class 0 or 1, with:
- Class 0 means that the image contains a square.
- Class 1 means that the image contains a circle.
100 people watched the training images, and classified them. y is the result probability, so y=0 means there is definitely a square, y=1 means there is definitely a round.
x
x is a feature derived from the images, by trying to fit them to a model of a circle, and calculating the error. So for example when x is very low, the probability of the image having a circle is high (relatively).
plot(x,y)
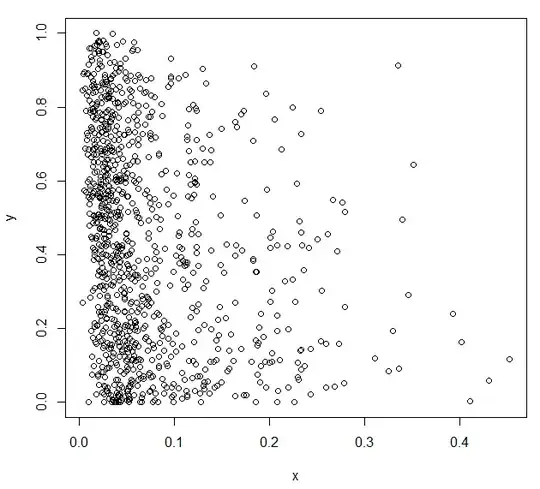
x,y (1000 values for each) pasted here: http://tny.cz/c320180d
Using mean(y) as a predictor, I get RMSE = 0.285204:
N = length(x)
average = mean(y)
RMSE = sqrt( 1/N * sum( (average-y)^2 ) )
RMSE
[1] 0.285204
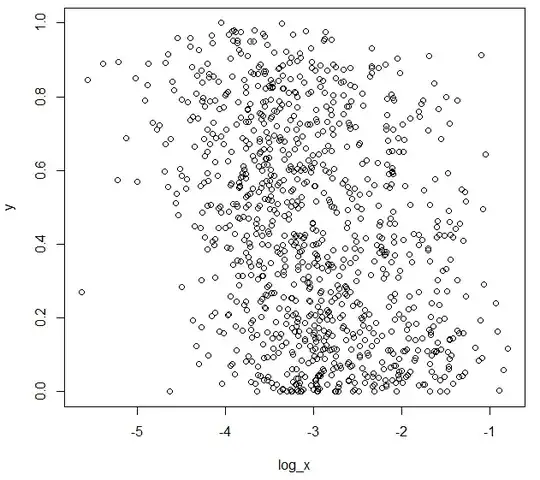
Then using a linear regression on log(x), I could improve a little bit the RMSE = 0.2694513:
log_x = log(x)
plot(log_x,y)
lm.result = lm(formula = y ~ log_x)
abline(lm.result, col="blue") # not working very well
linear_prediction = predict( lm.result, new, se.fit = TRUE)
prediction_linear_regression = matrix(0,N,1)
prediction_linear_regression = linear_prediction$fit
RMSE_linear_regression = sqrt( 1/N * sum( (prediction_linear_regression-y)^2 ) )
RMSE_linear_regression
[1] 0.2694513
Can the RMSE be further improved? What should I try?