2

I have been trying to establish whether I could model my data, a set of 90 observations, using the normal distribution. I have tried the Shapiro-Wilk and the Anderson-Darling tests but each came back with a different result.

Anderson-Darling normality test

data: x A = 0.6994, p-value = 0.06555

Shapiro-Wilk normality test

data: x W = 0.9645, p-value = 0.0154

If we are to use the strong 1% significance level, the null of normality cannot be rejected in either case. Using the 5% size, however, we see that the SW test rejects the null while the AD one narrowly accepts it.

The results are conflicting and I do not know on which to place my trust. If I knew the power of each test, I could make up my mind so is there perhaps a way to obtain the power functions in R? The Normal distribution is easy to work with and it would make sense in my case seeing that my observations are test scores but I do not want to make farfetched assumptions.

I also have to say that personally, I am not convinced that the underlying distribution is normal. Please take a look at the histogram below, upon which I have fitted a normal distribution with the same mean and standard deviation.

enter image description here

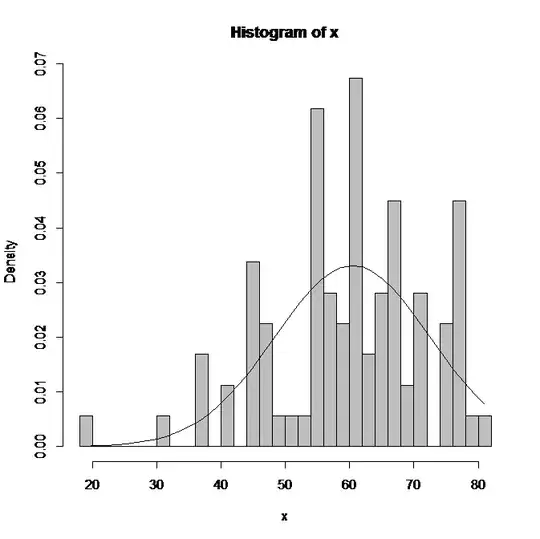
It does not seem to be a good match. Below is the normal qq plot:

enter image description here

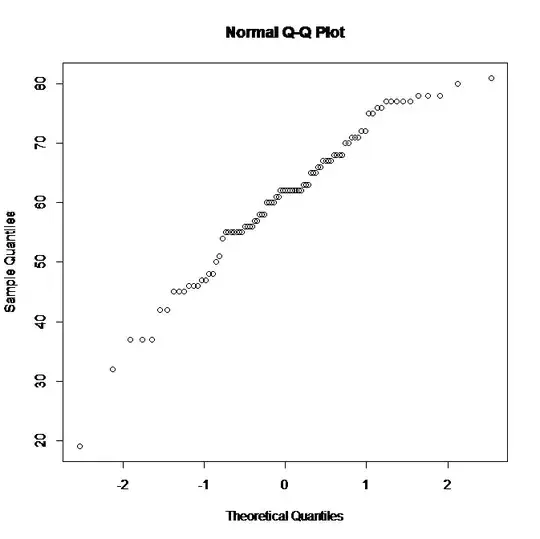
There is a hint of linearity but there are also a lot of outliers. As far as I know, the Shapiro-Wilk test is based on order statistics and it does not support the normality hypothesis.

If we were to reject the normality of my data, then what would be an acceptable distribution here? Note that we are looking for a negatively skewed one.

All suggestions are welcome. Thank you.

EDIT: This is my vector of observations in ascending order, i.e. the 89 order statistics, in case anyone wants to test it further:

sort(x)

19 32 37 37 37 42 42 45 45 45 46 46 46 47 47 48 48 50 51 54 55 55 55 55 55 55 55 56 56 56 56 57 57 58 58 58 60 60 60 60 61 61 62 62 62 62 62 62 62 62 62 62 63 63 63 65 65 65 66 66 67 67 67 67 68 68 68 68 70 70 71 71 71 72 72 75 75 76 76 77 77 77 77 77 78 78 78 80 81

JohnK
  • 18,298
  • 10
  • 60
  • 103
  • What is your data like? Is it continuous or discrete? It doesn't look too off from normal to me. You might also try a quantile normal plot. – Peter Flom Jan 07 '14 at 11:31
  • 1
    @PeterFlom It is test scores, so discrete values. I have posted the normal qq plot as well. Feel free to take a look. Thank you. – JohnK Jan 07 '14 at 11:48
  • 1
    OK, then my next question is what you are going to use this variable for - are you simply trying to model it as a single variable, or are you planning to use it in a regression or some other model? – Peter Flom Jan 07 '14 at 12:08
  • 1
    @PeterFlom Simply model it as a single variable. To that end, I am looking for the distribution that is the best fit. – JohnK Jan 07 '14 at 12:11
  • 2
    OK, then if the values are discrete (and not very numerous, e.g. 50, 60, 70 etc) then you may want to look at some discrete distributions. If the values range from 50 to 100 with many levels (e.g. 50, 62, 64, 71 etc) then a continuous distribution may be fine. I don't know of one that will fit better than the normal, but other people here may. – Peter Flom Jan 07 '14 at 12:15
  • @PeterFlom I should also post the vector of observations in ascending order, i.e. the 89 order statistics. By the way, your suspicion of normality is justified; I have taken some custom probabilities, i.e. the number of values in different intervals and compared them to the respective probabilities of a normal distribution with the same mean and sd, and they are not too far off. I will see if I can find an even better fit though. Thank you. – JohnK Jan 07 '14 at 12:20
  • 1
    **Obviously** your data are non-normal. What, then, is the purpose of testing normality? What will you be concluding from fitting some kind of non-Normal distribution to these data? – whuber Jan 07 '14 at 15:08
  • @whuber I did not know beforehand that my data are not normal; I had to test for it. I am mostly curious about the power of normality tests and the most commonly used negatively skewed distributions and I was hoping people with modelling experience could share their wisdom. – JohnK Jan 07 '14 at 15:25
  • 2
    John, in that case you are asking perhaps the most extensively discussed question on our site. A search on [normality+test](http://stats.stackexchange.com/search?q=normality+test) turns up several thousand posts! The top hits look relevant. If you sort by votes, you will quickly find this thread: http://stats.stackexchange.com/questions/2492, which I recommend. To narrow the search include "Kolmogorov" and/or "Shapiro" among the keywords. To broaden it, perform analogous Google searches (which may turn up comments: much of this discussion has occurred in comments). – whuber Jan 07 '14 at 15:29
  • 1
    @whuber Yes indeed. I have been studying the question and the responses. Amongst the thousands of google search results, I found that many people critisize the KS test for its low power (and that's why I did not include it in my tests). My impression is that the majority considers the SW test to be the most powerful one. My second question remains, though. Is there a procedure to determine the best fit for such data, in case the normality hypothesis is so clearly rejected? – JohnK Jan 07 '14 at 15:45
  • 3
    There are *loads* of procedures to fit distributions to data, because different problems and situations require different versions of "best" when it comes to fitting. The right version to employ depends on your ultimate purpose, which brings us right back to my original question: *why are you doing this?* – whuber Jan 07 '14 at 15:49
  • @whuber I see. I do not have an ultimate purpose in mind yet. My aim was to familiarise myself with some of these procedures for educational purposes. I am not wasting your time, I hope. Thank you. – JohnK Jan 07 '14 at 16:05
  • 4
    A great review of goodness-of-fit tests was published in 1974 by M. A. Stephens in JASA, [EDF statistics for goodness of fit and some comparisons](http://www.math.utah.edu/~morris/Courses/6010/p1/writeup/ks.pdf). It is still well worth reading as an introduction to the subject, for its survey of effective tests, and for its power studies. – whuber Jan 07 '14 at 16:10

3 Answers3

5

You may want to take a look at this question: Is normality testing 'essentially useless'? Answers discuss the Shapiro-Wilk test, particularly the accepted answer, which includes a simulation test.

Your problem may be different than most if you're not concerned with the distribution for the sake of meeting another planned analysis' assumptions though. Fitting a normal distribution to your data may only prompt you to ignore its peculiarities if they're small enough. If there isn't another analysis you need to perform that assumes normality, rather than trying to fit a known distribution to yours, you might consider describing your distribution in terms of its skewness and kurtosis, and add confidence intervals if you like (but consider relevant precautions in doing so).

Nick Stauner
  • 11,558
  • 5
  • 47
  • 105
0

The fly in the ointment seems to be that the data is in integer format suggesting a discrete distribution rather than a continuous one. Ignoring that problem and using the FindDistribution routine in Mathematica, it would seem that the best three single distributions (i.e., baring mixture distributions) from the set of possible continuous distributions for TargetFunctions consisting of BetaDistribution, CauchyDistribution, ChiDistribution, ChiSquareDistribution, ExponentialDistribution, ExtremeValueDistribution, FrechetDistribution, GammaDistribution, GumbelDistribution, HalfNormalDistribution, InverseGaussianDistribution, LaplaceDistribution, LevyDistribution, LogisticDistribution, LogNormalDistribution, MaxwellDistribution, NormalDistribution, ParetoDistribution, RayleighDistribution, StudentTDistribution, UniformDistribution, WeibullDistribution, HistogramDistribution are:

                                     PearsonChiSquare   CramerVonMises   BIC     AIC      HQIC      LogLikelihood   ComplexityError Internal    Score
NormalDistribution[60.1584,12.8297]  0.006103           0.4287          -7.877   -7.864   -7.885    -3.909          2.,3.909        -7.893      -7.893
WeibullDistribution[5.70531,65.0624] 0.3212             0.7483          -7.818   -7.805   -7.826    -3.879          2.,3.879        -7.899      -7.899
LogisticDistribution[60.952,7.12212] 0.2039             0.7964          -7.872   -7.859   -7.88     -3.906          2.,3.906        -7.969      -7.969

One of the problems of using continuous distributions to emulate integers is that the test statistics evaluate to exact numbers such that the integers have to be floated to calculate answers. In this case, for the normal distribution fit:

                    Statistic   P-Value
Anderson-Darling    0.699211    0.0664431
Baringhaus-Henze    0.418751    0.246541
Cramér-von Mises    0.105401    0.0939213
Jarque-Bera ALM     7.82865     0.0432369
Mardia Combined     7.82865     0.0432369
Mardia Kurtosis     1.00984     0.312573
Mardia Skewness     5.88896     0.0152361
Pearson Chi^2       20.4045     0.0256508
Shapiro-Wilk        0.964452    0.0153961

You would get entirely different answers if the search were restricted to discrete distributions, so, what's the case here?

Carl
  • 11,532
  • 7
  • 45
  • 102
-2

I use the Fisher´s H=-2*(log p1 + log p2) that follows a 4 df Chi-Square H=5.99 which p-value. 95% confidence, is 0.1919.

licas
  • 18
  • 4
  • This is invalid due to the very strong positive correlation one would expect between two tests on the same data. – whuber Mar 11 '17 at 21:21