I am using Sweave and xtable to generate a report.
I would like to add some coloring on a table. But I have not managed to find any way to generate colored tables with xtable.
Is there any other option?
I am using Sweave and xtable to generate a report.
I would like to add some coloring on a table. But I have not managed to find any way to generate colored tables with xtable.
Is there any other option?
Although I didn't try this explicitly from with R (I usually post-process the Tables in Latex directly with \rowcolor, \rowcolors, or the colortbl package), I think it would be easy to do this by playing with the add.to.row arguments in print.xtable(). It basically expect two components (passed as list): (1) row number, and (2) $\LaTeX$ command. Please note that command are added at the end of the specified row(s).
It seems to work, with the colortbl package. So, something like this
<<result=tex>>
library(xtable)
m <- matrix(sample(1:10,10), nr=2)
print(xtable(m), add.to.row=list(list(1),"\\rowcolor[gray]{.8} "))
@
gives me
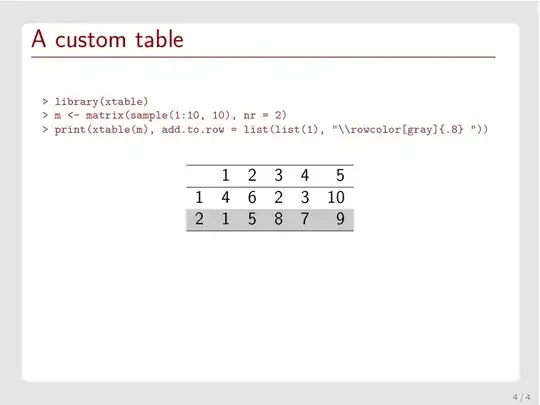
(This is a customized Beamer template, but this should work with a standard document. With Beamer, you'll probably want to add the table option when loading the package.)
Update:
Following @Conjugate's suggestion, you can also rely on Hmisc facilities for handling $\TeX$ output, see the many options of the latex() function. Here is an example of use:
library(Hmisc)
## print the second row in bold (including row label)
form.mat <- matrix(c(rep("", 5), rep("bfseries", 5)), nr=2, byrow=TRUE)
w1 <- latex(m, rownamesTexCmd=c("","bfseries"), cellTexCmds=form.mat,
            numeric.dollar=FALSE, file='/tmp/out1.tex')
w1  # call latex on /tmp/out1.tex
## highlight the second row in gray (as above)
w2 <- latex(m, rownamesTexCmd=c("","rowcolor[gray]{.8}"),
            numeric.dollar=FALSE, file='/tmp/out2.tex')
w2