2

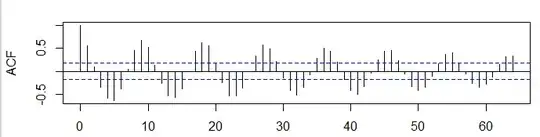
Why does the ACF of an AR(1) contains sometimes a sinusoid-like pattern? and what does it mean?

enter image description here

EDIT

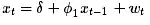
I think the time series is fit to AR(1). As I understand it, in an AR model, the value of x at time t is a linear function of the value of x at time t–1.

enter image description here

If wt is random, then we see a random Figure in correlogram. If not, we can see a pattern in correlogram, is it correct? If yes why do we see here a sinusoid pattern? In this case has the wt (Residual) a constant value?

Nick Cox
  • 48,377
  • 8
  • 110
  • 156
TangoStar
  • 419
  • 6
  • 13
  • 1
    "Sine" and "sinusoid" are the usual English words. It implies periodicity. In your case, the peaks at 9, 18, 27, 36, ... imply a period of 9. What does AR(1) have to do with your question? – Nick Cox Dec 11 '13 at 10:01
  • I have edited my post – TangoStar Dec 11 '13 at 10:18
  • 1
    Presumably `wt` is just the name of your variable in whatever software you are using. You call it a residual, but don't explain what the model is. I am not a time series expert, but my understanding is that AR(1) itself won't show periodicity in the acf, but just a decline with lag. No autocorrelation like that is consistent with a constant value. – Nick Cox Dec 11 '13 at 10:27
  • but If I calculate the acf for high lags i.e 100th, the correlogram is already 0(the figure goes slowly to 0). it is a property of AR(1) in correlogram. The formula is in my above post is for AR(1) from [here](https://onlinecourses.science.psu.edu/stat510/?q=node/60). I want to know which parameter should this formula have, to correlogram be sinusoid – TangoStar Dec 11 '13 at 10:37
  • 1
    If $\phi_1$ is negative you can get an alternating and damping pattern, see [this page](https://onlinecourses.science.psu.edu/stat510/?q=node/60) but that's not sinusoidal. I am also not a time-series expert but I think you'd need a more complex model to get the pattern you show. – Peter Flom Dec 11 '13 at 11:42
  • 1
    It's important to distinguish between the empirical ACF, especially from a short series (you have what? 65, 70 observations?) & the theoretical one - the expectation. You certainly can get wavy patterns from an AR(1) process, but the expected ACF exponentially decays. In any case the strength & persistence of the pattern in your plot suggests a periodic (seasonal) effect inconsistent with an AR(1) process. – Scortchi - Reinstate Monica Dec 11 '13 at 20:34
  • @Scortchi thank you so much for your answer. As I understood, If we see seasonalty in correlogram, it is incosistent with AR(1), could you please explain me,why? – TangoStar Dec 12 '13 at 09:06

0 Answers0