3

Step 1. To answer "Final Question"

( linked: "https://stats.stackexchange.com/questions/79246/the-final-question-order-of-differencing-to-achieve-stationary-and-interpreta")

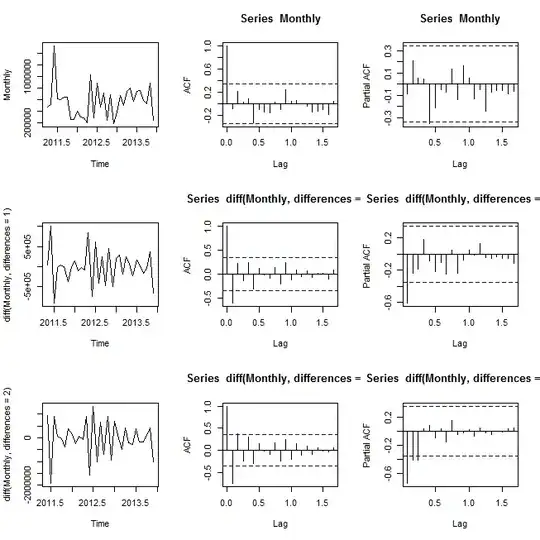
Expecting to find correct order of difference to achieve stationary.


Some Result of test for stationary on monthly times series only.

  1. Dickey fuller

  2. KPSS test

  3. Phillips–Perron test

If required i can provide test result for the any order difference.

  > urdfTest(Monthly, lags=1, type = c("nc","c","ct"), doplot = TRUE)

Title:
 Augmented Dickey-Fuller Unit Root Test

Test Results:

  Test regression none 

  Call:
  lm(formula = z.diff ~ z.lag.1 - 1 + z.diff.lag)

  Residuals:
      Min      1Q  Median      3Q     Max 
  -526683 -135297   24570  176578 1078796 

  Coefficients:
             Estimate Std. Error t value Pr(>|t|)    
  z.lag.1    -0.08703    0.09829  -0.885 0.383219    
  z.diff.lag -0.61315    0.15711  -3.903 0.000521 ***
  ---
  Signif. codes:  0 ‘***’ 0.001 ‘**’ 0.01 ‘*’ 0.05 ‘.’ 0.1 ‘ ’ 1

  Residual standard error: 329300 on 29 degrees of freedom
  Multiple R-squared:  0.4195,  Adjusted R-squared:  0.3794 
  F-statistic: 10.48 on 2 and 29 DF,  p-value: 0.0003761


  Value of test-statistic is: -0.8854 

  Critical values for test statistics: 
        1pct  5pct 10pct
  tau1 -2.62 -1.95 -1.61  


     > urkpssTest(Monthly,  type = c("mu","tau"), lag = c("short","long","nil"), use.lag = NULL, doplot = TRUE)

    Title:
     KPSS Unit Root Test

    Test Results:

      Test is of type: mu with 3 lags. 

      Value of test-statistic is: 0.0986 

      Critical value for a significance level of: 
                      10pct  5pct 2.5pct  1pct
      critical values 0.347 0.463  0.574 0.739


    > urppTest(Monthly,  type = c("Z-alpha","Z-tau"), model = c("constant","trend"), lags = c("short","long"),use.lag = NULL, doplot = TRUE)

    Title:
     Phillips-Perron Unit Root Test

    Test Results:

      Test regression with intercept 

      Residuals:
          Min      1Q  Median      3Q     Max 
      -397594 -251734   26252  144863  954417 

      Coefficients:
                    Estimate Std. Error t value Pr(>|t|)    
      (Intercept)  6.169e+05  1.183e+05   5.215 1.27e-05 ***
      y.l1        -8.733e-02  1.857e-01  -0.470    0.641    
      ---
      Signif. codes:  0 ‘***’ 0.001 ‘**’ 0.01 ‘*’ 0.05 ‘.’ 0.1 ‘ ’ 1

      Residual standard error: 290200 on 30 degrees of freedom
      Multiple R-squared:  0.007322,    Adjusted R-squared:  -0.02577 
      F-statistic: 0.2213 on 1 and 30 DF,  p-value: 0.6415


      Value of test-statistic, type: Z-alpha  is: -39.5851 

               aux. Z statistics
      Z-tau-mu            5.2378

enter image description here

New Bie
  • 31
  • 4

2 Answers2

1

All three series look stationary; the second & third look over-differenced (the strong negative auto-correlation at the first lag is a tell-tale sign). Recall that the sign of a non-stationary series is strong auto-correlations that take a long time to die out with increasing lag. Plotting residuals is also a good idea—say a quantile–quantile plot & a time series plot of standardized residuals—to check their distribution & spot outliers.

There are no clear signs of auto-correlation in your original time series, suggesting you needn't fit an ARMA model unless you have good reason to. That's not to say there is no auto-correlation, just that if there is it's weak to moderate & its nature can't be determined from such a short series (36 observations?). A white noise model about the mean might be appropriate, perhaps a Gaussian or perhaps a t-distribution with 5–10 degrees of freedom.

Scortchi - Reinstate Monica
  • 27,560
  • 8
  • 81
  • 248
  • Yes: in this case some form of white noise looks to be a good candidate model. I don't know what you mean by an exponential model in this context. – Scortchi - Reinstate Monica Dec 11 '13 at 18:58
  • To have a residual plot i should be fitting a model first since my final objective is to create a relevant model. and since it is asked for i had fitted exponential smoothing via `Monthlyforcast – New Bie Dec 11 '13 at 19:00
  • How can i post the image of same ? – New Bie Dec 11 '13 at 19:04
  • what i know is an MA model is white noise model, please correct me i am wrong. so, should i try MA, required some more assistance in the content of same – New Bie Dec 11 '13 at 19:15
  • I meant just white noise about a constant mean: there's not really much sign of auto-correlation from your ACF plots, but the time-series looks perhaps a little spiky. – Scortchi - Reinstate Monica Dec 11 '13 at 19:16
1

Non-stationarity is a symptom with possibly many causes. One cause is a shift in the mean at one or more points in time. Another possible cause is a change in parameters at one or more points in time. Another cause is a deterministic change in error variance at one or more points in time. Prof. Spyros Makridakis wrote an article http://www.insead.edu/facultyresearch/research/doc.cfm?did=46900 of the danger of using differencing to render a series stationary. While I don't fully agree with all of his propositions it certainly details the error of assuming differencing as the remedy for non-stationarity.

IrishStat
  • 27,906
  • 5
  • 29
  • 55