26

Suppose that I have a variable like X with unknown distribution. In Mathematica, by using SmoothKernelDensity function we can have an estimated density function.This estimated density function can be used alongside with PDF function to calculate probability density function of a value like X in the form of PDF[density,X] assuming that "density" is the result of SmoothKernelDensity. It would be good if there is such feature in R.This is how it works in Mathematica

http://reference.wolfram.com/mathematica/ref/SmoothKernelDistribution.html

As an example (based on Mathematica functions):

data = RandomVariate[NormalDistribution[], 100]; #generates 100 values from N(0,1)

density= SmoothKernelDistribution[data]; #estimated density

PDF[density, 2.345] returns 0.0588784 

Here you can find more information about PDF:

http://reference.wolfram.com/mathematica/ref/PDF.html

I know that I can plot its density function using density(X) in R and by using ecdf(X) I can obtain its empirical cumulative distribution function.Is it possible to do the same thing in R based on what I described about Mathematica?

Any help and idea is appreciated.
Amin
  • 459
  • 1
  • 4
  • 13
  • `density(x)` gives an estimate of the pdf, as you already noted, but its suitability depends on the purpose for which you want to have the density. Note, for example, that the variance is biased up (in performing convolution, you add the variance of the kernel to the variance of the data, itself an unbiased estimate) - such bias-variance tradeoffs are ubiquitous. There are other alternatives, such as log-spline density estimation, for example -- but again, its suitability partly depends on what you want to do with it. – Glen_b Dec 05 '13 at 23:08
  • @Glen_b I want to use the estimated density for finding the probability of other values in the distribution. For instance, I have a vector of data ranging from 0 to 10.This data set contains only 70 unique values between 0 and 10. I can plot the density. Now suppose that I'm interested on finding the probability of having X=7.5, which is not in observed data, in a random sampling.How can I get it? I know that `ecdf(X)` gives me the equivalent percentile of 7.5 but it's not what I'm looking for. – Amin Dec 05 '13 at 23:59
  • 1
    "*finding the probability of having X=7.5*" -- there's your problem! Either you have a continuous distribution (in which case the actual answer is "0"), or you don't (in which case you shouldn't be using density estimation, because you don't have a density). – Glen_b Dec 06 '13 at 06:17
  • @Glen_b You're right.I should have used right wordings.Suppose that I'm interested on P(7 – Amin Dec 06 '13 at 06:59
  • 1
    Note the definition of the ecdf (or the cdf more generally); `ecdf(b)-ecdf(a)` would estimate $P(\text{a} – Glen_b Dec 06 '13 at 07:03
  • @Glen_b Thanks for the quick reply. In case of discrete distribution, why I should look for proportion of values that are 0.75 and not 7.5? Was that a typo? What if I'm looking for probability of a value that is not in the observed data? – Amin Dec 06 '13 at 07:10
  • 1
    Sorry, that was an error. I mean the sample proportion of values that are 7.5; my son distracted me as I was typing the last couple of words. Your sample estimate of the probability of an unobserved event is zero. Did you want to apply a prior? Did you want a confidence interval for the proportion instead of a point estimate? Your actual issue is not yet an R issue, your issue is in correctly explaining what it is you actually want. You should probably edit your question, or post a new one. – Glen_b Dec 06 '13 at 07:14
  • @Glen_b regardless of our discussion, my question is clear. I want to know if it's possible to find probability based on estimated density (assume for a continuous variable) in R as what we can do in Mathematica. – Amin Dec 06 '13 at 15:50
  • (i) I don't know what Mathematica does; you don't give enough information\* for me to guess; (ii) if, as your question still suggests, it is giving probabilities for particular outcomes ($P(X=x)$) for a *density*, then it's simply wrong (so perhaps it's not doing that - are you still confusing density and probability?); (iii) I've already discussed here in comments several things that *can* be done (probabilities for discrete distributions, probabilities of ranges for continuous distributions). Please clarify your question. You *claiming* that it's clear doesn't make it so. ...ctd – Glen_b Dec 06 '13 at 15:58
  • (ctd) * To be more specific about Mathematica, your statements about what it does are contradictory. Is it that you simply wish to evaluate the density (which is NOT probability) at some specific points? – Glen_b Dec 06 '13 at 16:00
  • @Glen_b this page talks about kernel density estimation in Mathematica and how to use it for further analysis [SmoothKernelDensity](http://reference.wolfram.com/mathematica/ref/SmoothKernelDistribution.html) If you look at examples you can see how estimated density can be used for calculating PDF or CDF. – Amin Dec 06 '13 at 16:00
  • Can you make your question reflect what you actually want, then? – Glen_b Dec 06 '13 at 16:05
  • @Glen_b I'm doing! – Amin Dec 06 '13 at 16:05
  • You are still persisting in calling the value of the density a probability in your question. Please fix your question. – Glen_b Dec 06 '13 at 16:18
  • @Glen_b sorry for the confusion.It's because of my shallow knowledge.I was just using the words I found in Mathematica help.I tried to make my question as much as possible clear (based on my knowledge) – Amin Dec 06 '13 at 16:21
  • Can you show me where Mathematica calls the value returned by PDF a *probability*? – Glen_b Dec 06 '13 at 16:49
  • Mathematica only calls it probability when the thing is discrete, when it's not a density (it shouldn't be called a pdf then, but they are simply using one function for both cases). Your question still calls the density a probability. It isn't. Please fix the question so it doesn't do that. It's not tricky - simply delete the part that calls density 'probability'. – Glen_b Dec 06 '13 at 17:14
  • @Glen_b are you saying that `PDF` in Mathematica gives the value of density function for given X value?and it's not probability? That was my impression from their definition. – Amin Dec 06 '13 at 17:58
  • The page you linked to on `PDF` is unambiguous. For continuous cases (as with what's returned by `SmoothKernelDistribution`) `PDF` returns a density, and they go to some lengths right on that page to make the distinction between density and probability clear. – Glen_b Dec 06 '13 at 23:56

2 Answers2

42

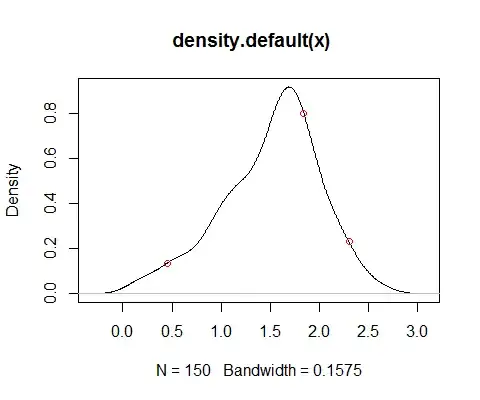
?density points out that it uses approx to do linear interpolation already; ?approx points out that approxfun generates a suitable function:

x <- log(rgamma(150,5))
df <- approxfun(density(x))
plot(density(x))
xnew <- c(0.45,1.84,2.3)
points(xnew,df(xnew),col=2)

enter image description here

By use of integrate starting from an appropriate distance below the minimum in the sample (a multiple - say 4 or 5, perhaps - of the bandwidth used in df would generally do for an appropriate distance), one can obtain a good approximation of the cdf corresponding to df.

Glen_b
  • 257,508
  • 32
  • 553
  • 939
  • this is interesting. It seems that `df(2.3)` gives the value of estimated density function at `x=2.3` but what `PDF` does in Mathematica is giving the area under curve above `x=2.3`. I'm not quite sure about this.This is just my guess.Can you re-produce what I did in Mathematica? – Amin Dec 06 '13 at 16:33
  • My function above demonstrably gives a kernel-based estimate of a "probability density function" ... "evaluated at x". Either you want that, or you don't. If you don't, you have to explain what you *do* want - in statistical terms, not just as 'reproduce this behavior'. – Glen_b Dec 06 '13 at 17:03
  • I think that I mistakenly and unintentionally have promoted that density is probability which is not. I didn't mean to be misleading.If you think that `PDF` in Mathematica does what you described in your answer (i.e. finding the value of density function for given X value) then I think that I got my answer. Just there are many confusion on using words! – Amin Dec 06 '13 at 18:04
  • 2
    From what the `PDF` page says it does, it returns the same kind of thing I do, but the methods it uses in its calculation in this case are likely to be somewhat more accurate (for such a purpose additional accuracy has little value, however). For some discussion of the probability/density distinction, see [here](http://stats.stackexchange.com/questions/48109/what-does-the-y-axis-in-a-kernel-density-plot-mean) and [here](http://stats.stackexchange.com/questions/4220/a-probability-distribution-value-exceeding-1-is-ok). – Glen_b Dec 07 '13 at 00:01
  • Because `density` samples equally spaced values, `cumsum` is a more expedient way to construct points along the CDF than integration might be. Linear interpolation then finishes the job of obtaining a function for the CDF. – whuber Nov 24 '21 at 19:34
1

spatstat.core::CDF() can be used to to create a cumulative density function from a given output from density().

set.seed(123)
x <- rnorm(10000000)

x_density <- density(x, n = 10000)

x_cdf <- spatstat.core::CDF(x_density)

sds <- c(-2, -1, 0, 1, 2)
names(sds) <- sds

# check cdf at different values
setNames(
  x_cdf(sds), 
  sds)
#>         -2         -1          0          1          2 
#> 0.02285086 0.15889356 0.50009332 0.84134448 0.97717762

# compare against theoretical
pnorm(sds)
#>         -2         -1          0          1          2 
#> 0.02275013 0.15865525 0.50000000 0.84134475 0.97724987

Created on 2021-11-22 by the reprex package (v2.0.0)

Update

A previous version of this answer copied code from the deprecated spatstat:::CDF() which was broken up (in ?2020?) into several other packages. If anyone knows a lighter weight package where this CDF function currently exists would love to hear about it in the comments!

Bryan Shalloway
  • 499
  • 5
  • 11
  • 1
    When `z` references the object returned by `density`, a CDF corresponding to `z` can be created easily *via* `f – whuber Nov 24 '21 at 15:11
  • 1
    @whuber that looks pretty great. I was also pointed to the {logspline} package. I did a quick benchmark and seems that the splinefun or approxfun approaches for interpolation are both way faster: https://gist.github.com/brshallo/ea2e04347e14fae7ff969a54e2266359 – Bryan Shalloway Nov 24 '21 at 18:26
  • I wrote a toy package here: https://github.com/brshallo/densdpqr that uses whuber's approach for doing this and other density --> distribution operations. – Bryan Shalloway Jan 05 '22 at 23:25