7

I re-edited this question for clarity:

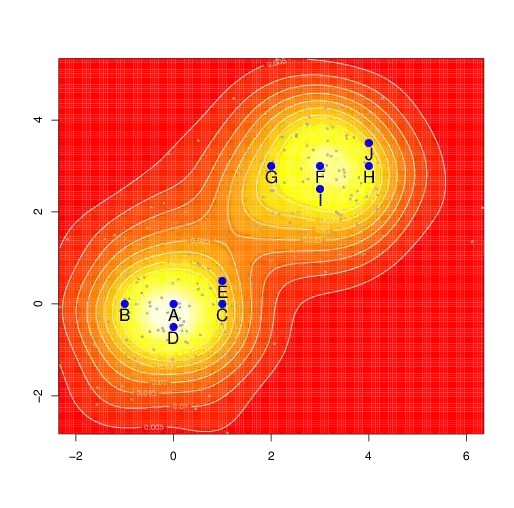
  1. I have coordinates obtained by tracking birds with GPS (all points in plot).
  2. I've used these points to perform kernel density estimation to reveal the areas with most dense bird activity (areas "1" and "2" in plot).
  3. I also know coordinates of nesting trees where each nest was protected by female and male (big blue points with labels ("A" ..."J").
  4. On each nest were done nest-defense recordings (10 min each recording, on three various intruders, twice per the same intruder)= 60 min total for each nest.
  5. Each bird (female and male) exhibit 4 behaviours: "attack", "threat", "jump","check". I have all these values (duration).

enter image description here

Thanks to David Robinson for his time. I've done mistake in refer! I want to refer to Table 2. in this article:

onlinelibrary.wiley.com/doi/10.1111/jbi.12048/full

In article is used analysis of molecular variance (AMOVA). May I use something similar to my data in order to explain: "source of variation"

  • among areas
  • among nesting trees within clusters
  • among individuals (female vs. male) within nesting tree

Is it a problem that this AMOVA is (probably) "designed" on genetic data? Which procedure in appropriate for my data? Or should I use nested ANOVA? How?

Thanks.

Ladislav Naďo
  • 2,202
  • 4
  • 21
  • 45
  • Just to be clear: you want to compare clusters of *nests* rather than clusters of birds (A+B+C+D+E to F+G+H+I+J)? And the attribute you want to compare within and between is the `attribute` column of `my.locs`? – David Robinson Nov 18 '13 at 17:31
  • possible duplicate of [Nested/SplitModel - RepeatedMeasures/MixedModel ANOVA: levels of nesting & scripting in R](http://stats.stackexchange.com/questions/46259/nested-splitmodel-repeatedmeasures-mixedmodel-anova-levels-of-nesting-scrip) – Ladislav Naďo Nov 20 '13 at 10:59
  • This question has an answer and can not be deleted @NickCox – Ladislav Naďo Nov 20 '13 at 12:06

1 Answers1

4

You can do this with an ANOVA analysis:

my.locs$cluster = factor(rep(c(1, 2), each=5))
anova(lm(attribute ~ cluster, my.locs))

# Analysis of Variance Table
# 
# Response: attribute
#           Df Sum Sq Mean Sq F value Pr(>F)
# cluster    1   62.5   62.50  0.1109 0.7477
# Residuals  8 4510.0  563.75               

This finds the variance within and between groups, and uses an F-test to determine a p-value. For the simulated data, the p-value is 0.7477, indicating there is not a significant difference between the clusters of nests (not surprising, since the data was randomly generated without distinguishing between clusters).

David Robinson
  • 15,190
  • 4
  • 24
  • 40
  • @LadislavNado: Table 3 in that article looks at *pairwise* statistics (sequence distances and pairwise Fst values), so they had no choice but to use that method. However, what you have is one aggression value per nest, and determining whether one set of nests has a higher aggression value than another. That's exactly what ANOVA is designed to do – David Robinson Nov 18 '13 at 19:13
  • I re-edited the quenstion. – Ladislav Naďo Nov 19 '13 at 20:32
  • Last note :D ..... i found nested ANOVA - it will solve my problem. Thanks a lot anyway. – Ladislav Naďo Nov 20 '13 at 10:57