8

I have a lottery style dataset we produce internally (example below). I am trying to figure out which numbers appear most frequently together. Example questions: What are the top 10 pair of numbers that appear most frequently together? What are the top 10 three numbers that appear most frequently together?

What methods/techniques would I need to use to answer these questions?

I was thinking clustering at first but a test run (ward) I performed, didn't return the results I was expecting.

enter image description here

mdewey
  • 16,541
  • 22
  • 30
  • 57
daniellopez46
  • 905
  • 1
  • 10
  • 16
  • 1
    You might be able to mine [a closely related thread](http://stats.stackexchange.com/questions/32531/r-sequence-recognition-for-univariate-data-sequence-mining) for useful ideas. Provided you have few columns (only five are shown in the example), it would take little to adapt the solutions. – whuber Nov 12 '13 at 20:17
  • 2
    On the question\* "which pairs of numbers appear most often together", I'd start with cross-tabulations. $\quad\,\,\,$ $\, $\* the 'question' is actually a host of somewhat different questions, depending on things like whether the pair (Num1=3,Num2=5) is considered the same as (Num1=5,Num2=3) (does order matter?), or whether it's considered the same as (Num1=3,Num5=5) (do the column labels matter?) – Glen_b Nov 12 '13 at 21:42
  • @whuber...thanks for the link. That sounds like something that could be modified to answer my question. And I am using r. But not sure I have the necessary skill level yet to adapt that r code. I'll give it shot though. – daniellopez46 Nov 12 '13 at 22:25
  • @Glen_b Great clarifying question. Order doesn't matter. The three examples you gave are all equivalent for the question I am asking. Also, the numbers are non-repeating for each row. – daniellopez46 Nov 12 '13 at 22:33
  • 1
    Then it sounds like you could collapse all the pairwise cross-tabulations into a single table (add the counts from all pairwise tables), then add the counts from that single table to its transpose (since order doesn't matter), and take the lower triangular portion of that combined table (since its symmetric). Then find the biggest counts in that table ... and that gives the pairs that occur together the most. (If that's useful to you let me know and I'll write it up as an answer) – Glen_b Nov 12 '13 at 22:58
  • @Glen_b I think I follow you. For example, the first row of the above dataframe would be, for doubles,triples, quadruples,quintuples, transformed into a factor vector. Something like this: c({3,5},{3,7},{3,10},{3,13},{5,7},{5,10},{5,13},{7,10},{7,13},{10,13},{3,5,7},{3,5,10},{3,5,13},{3,7,10},{3,7,13},{3,10,13},{5,7,10},{5,7,13},{5,10,13},{7,10,13},{3,5,7,10},{3,5,7,13},{3,5,10,13},{3,7,10,13},{5,7,10,13},{3,5,7,10,13}). I did this semi-manually in Excel. If I did it right my counts for each grouping: 10, 10, 5, 1. Agains this is for non-repeating-order-doesn't-matter combinations. – daniellopez46 Nov 13 '13 at 18:32
  • This is really helping me think through this. (BTW I'm using R). Each row needs to be transformed like in my previous comment and then all these resulting factor vectors need to be stacked into one factor vector called "combo" for example. Now I know what I want my finaly dataframe to look like. Here it is in pseudo code: data.frame(group=c(2,3,4,5), Orig=c(corresponding row.num of orig dataframe,combo=combo). Then in this format I can count and get top 10 (or any top x) for any group. – daniellopez46 Nov 13 '13 at 18:46
  • @Glen_b short answer is, if we are on the same page, yes, I would like to see your answer. As it stands it took me like half hour to convert one row using Excel and some formulas and I am not 100% sure I got all combinations. My actual dataframe has about 2000 rows. If your answer is written as a solution in R that will be a huge plus. Or at least something that I can more readly translate into R than my "solution". – daniellopez46 Nov 13 '13 at 18:59

3 Answers3

4

This question calls for a modification of the solution to a sequence counting problem: as noted in comments, it requests a cross-tabulation of co-occurrences of values.

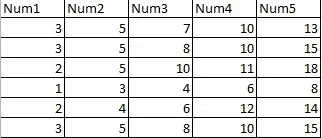
I will illustrate a naive but effective modification with R code. First, let's introduce a small sample dataset to work with. It's in the usual matrix format, one case per row.

x <- matrix(c(3,5,7,10,13,
              3,5,8,10,15,
              2,5,10,11,18,
              1,3,4,6,8,
              2,4,6,12,14,
              3,5,8,10,15),
            ncol=5, byrow=TRUE)

This solution generates all possible combinations of $m$ items (per row) at a time and tabulates them:

m <- 3
x <- t(apply(x, 1, sort))
x0 <- apply(x, 1, combn, m=m)
y <- array(x0, c(m, length(x0)/(m*dim(x)[1]), dim(x)[1]))
ngrams <- apply(y, c(2,3), function(s) paste("(", paste(s, collapse=","), ")", sep=""))
z <- sort(table(as.factor(ngrams)), decreasing=TRUE)

The tabulation is in z, sorted by descending frequency. It is useful by itself or easily post-processed. Here are the first few entries of the example:

> head(z, 10)
 (3,5,10) (3,10,15)  (3,5,15)   (3,5,8) ... (8,10,15) 
        3         2         2         2 ...         2

How efficient is this? For $p$ columns there are $\binom{p}{m}$ combinations to work out, which grows as $O(p^m)$ for fixed $m$: that's pretty bad, so we are limited to relatively small numbers of columns. To get a sense of the timing, repeat the preceding with a small random matrix and time it. Let's stick with values between $1$ and $20,$ say:

n.col <- 8       # Number of columns
n.cases <- 10^3  # Number of rows
x <- matrix(sample.int(20, size=n.col*n.cases, replace=TRUE), ncol=n.col)

The operation took two seconds to tabulate all $m=3$-combinations for $1000$ rows and $8$ columns. (It can go an order of magnitude faster by encoding the combinations numerically rather than as strings; this is limited to cases where $\binom{p}{m}$ is small enough to be represented exactly as an integer or float, limiting it to approximately $10^{16}$.) It scales linearly with the number of rows. (Increasing the number of possible values from $20$ to $20,000$ only slightly lengthened the time.) If that suggests overly long times to process a particular dataset, then a more sophisticated approach will be needed, perhaps utilizing results for very small $m$ to limit the higher-order combinations that are computed and counted.

whuber
  • 281,159
  • 54
  • 637
  • 1,101
  • @ whuber. Thanks for your posted Answer. Why is the output of z showing a count of 5 for (3,5,10)? Based on the original matrix I was expecting to see a count of 3. This would come from rows x[c(1:2,6),]. If I enter m – daniellopez46 Nov 14 '13 at 18:31
  • Sorry: although I checked that, I misread the output and did not catch the discrepancy. There was a typo in the code where "2" appeared but "m" should have (and `R` issued no warnings about a mismatch between the sizes of arrays `x0` and `y`; it merely "recycled" the elements). I fixed that typo and pasted the new output. You might find it informative (and reassuring) to run the code and inspect the array `y`, which contains all the $m$-tuples for each row in `x`. As another check, `sum(z)` should equal $\binom{p}{m}$ times the number of rows in $x$: $\binom{5}{3}\times 6=60$ in the example. – whuber Nov 14 '13 at 18:41
  • 1
    np. I was actually just inspecting y as you were writing your answer and thinking "I was not expecting to see 15 columns for m – daniellopez46 Nov 14 '13 at 18:55
2

You are not looking for clustering.

Instead, you are looking for frequent itemset mining. There are dozens of algorithms for this, the most widely known probably are APRIORI, FP-Growth and Eclat.

Has QUIT--Anony-Mousse
  • 39,639
  • 7
  • 61
  • 96
0

I use a simple Excel spreadsheet and load all the drawings and then do a data sort. When you do a data sort you can learn quickly which numbers will never and have never played together. I've also written Macros that can run pairs and 3 pairs.

gung - Reinstate Monica
  • 132,789
  • 81
  • 357
  • 650
Jack
  • 1
  • 1