6

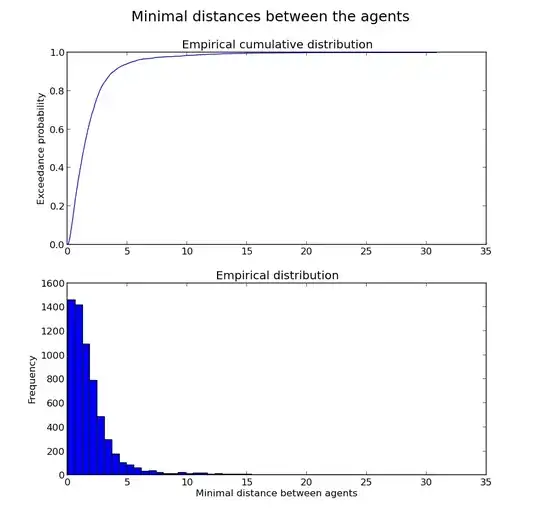
I am trying to fit my data to the one of the continuous PDF (I suggest it to be gamma- or lognormal-distributed). The data consists of about 6000 positive floats. But the results of the Kolmogorov-Smirnov test completely refute my expectations providing the very low p-values.

Data empirical distribution

enter image description here

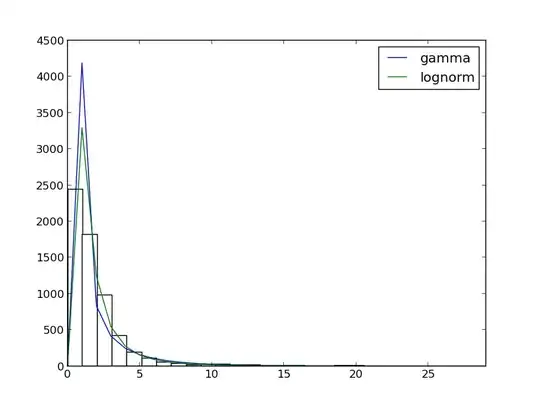
Distribution fitting enter image description here

Python code:

import numpy
import sys
import json
import matplotlib.pyplot as plt
import scipy
from scipy.stats import *

dist_names = ['gamma', 'lognorm']
limit = 30

def distro():
    #input file
    with open(sys.argv[1]) as f:
        y = numpy.array(json.load(f))

    #output
    results = {}
    size = y.__len__()
    x = scipy.arange(size)
    h = plt.hist(y, bins=limit, color='w')
    for dist_name in dist_names:
        dist = getattr(scipy.stats, dist_name)
        param = dist.fit(y)
        goodness_of_fit = kstest(y, dist_name, param)
        results[dist_name] = goodness_of_fit
        pdf_fitted = dist.pdf(x, *param) * size
        plt.plot(pdf_fitted, label=dist_name)
        plt.xlim(0, limit-1)
        plt.legend(loc='upper right')
    for k, v in results.iteritems():
        print(k, v)
    plt.show()

This is the output:

  • p-value is almost 0 'lognorm', (0.1111486360863001, 1.1233698406822002e-66)
  • p-value is 0 'gamma', (0.30531260123096859, 0.0)

Does it mean that my data does not fit gamma distribution?.. But they seem so similar...

gung - Reinstate Monica
  • 132,789
  • 81
  • 357
  • 650
Vitaly Isaev
  • 103
  • 1
  • 9
  • 3
    With so many data points, the standard error of the KS statistic is very small, and so the fact that it's visually a reasonable fit is irrelevant - the test can still tell it doesn't fit. But note that you're misapplying the Kolmogorov Smirnov test, since it's a test for a completely specified distribution and you're estimating parameters from the data. In any case it's not clear to me why you'd do a hypothesis test here. Do you really believe the true population distribution is exactly gamma or lognormal? Why? What would convince you of that rather than something else that looks like that?... – Glen_b Nov 03 '13 at 02:44
  • 5
    (ctd)... and if you think it's only an approximation, why wouldn't you anticipate rejection in a large sample? If you're interested in 'is this a good approximation?' try looking at QQ plots, which will tell you where the devaitions occur and that may help you decide if it's 'near enough' for whatever purpose you'd want to specify an approximate distributional form for. – Glen_b Nov 03 '13 at 02:47
  • Thank you for responce. The aim of my work is the comparing of the several empirical distributions (kind of the one being discussed here). I wanted to use parametric methods in order to estimate the significance of the distribution parameters difference. But they seem to be restricted because of such a good results of fitting – Vitaly Isaev Nov 03 '13 at 20:26
  • 1
    Why use such simple parametric models when you have so much data? – Glen_b Nov 03 '13 at 21:56
  • Just a lack of knowledge... :) I would be appreciated if you give me advice about the modern methods of empirical distributions comparison. – Vitaly Isaev Nov 03 '13 at 22:50
  • It depends on what features/aspects of the distribution you're particularly interested in (such as location, spread, skewness, particular quantiles, tail index or whatever). If you're just interested in finding general differences, of course there are omnibus tests like a two sample Kolmogorov-Smirnov test. If you want to reduce differences to a few easily described parameters, what you can do is start with a good approximation (such as gamma or lognormal), then use the approach of Smooth Tests of goodness of fit such as those that Rayner and Best have been working with, ...(ctd) – Glen_b Nov 03 '13 at 23:30
  • (ctd) ... where a family of orthogonal polynomials is used to characterize the deviations from that simple model. ... e.g. in the case of lognormal, it's easiest to take logs (going to a normal base model) and then fit models for data off orthogonal (Hermite) polynomials around that. You can characterize differences in terms of differences among low order terms. $\quad\quad\quad\quad\quad$ ... but it really depends on what you're interesting in finding out/comparing. – Glen_b Nov 03 '13 at 23:31

1 Answers1

8

Yes. Neither of these distributions is a good fit for your data by that criterion. There are some other distributions you could try, but it strikes me as (ultimately) unlikely that real data come from any of the well-studied distributions, and you have 6k data, so even a trivial discrepancy will make the test 'significant'. (For more along those lines, see: Is normality testing 'essentially useless'?)

On the other hand, instead of checking to see if your data significantly diverge from these distributions, you could see how well your data correlate with the distributions you are interested in--the fit may well be 'good enough' for your purposes. (For more along these lines, see my answer here: Testing randomly generated data against its intended distribution.)

gung - Reinstate Monica
  • 132,789
  • 81
  • 357
  • 650
  • Thank you for your reply. Your idea of a real-world and theoretical distributions principle discrepancy put me in a deadlock. But now I am inclined to accept your point of view, because I checked the goodness of fit for another 80 continuos PDF implemented in scipy.stats: – Vitaly Isaev Nov 03 '13 at 13:47
  • alpha 0.0 anglit 4.52300439976e-249 arcsine 0.0 beta 7.53500998959e-08 betaprime 0.0 bradford 0.0 burr 0.0 cauchy 0.0 chi 1.24814713547e-84 chi2 1.04723677282e-84 cosine 1.77417135669e-226 dgamma 1.48472973977e-152 dweibull 3.36030891852e-159 erlang 1.53825130531e-11 expon 8.49161219825e-20 exponpow 1.82371695398e-57 exponweib 0.00720597428858 f 0.0 fatiguelife 2.05556834159e-06 fisk 0.0 foldcauchy 0.0 foldnorm 1.21106424575e-143 frechet_l 0.0 frechet_r 6.96536022471e-14 – Vitaly Isaev Nov 03 '13 at 14:04
  • gamma 0.0 gausshyper 0.0 genexpon 1.7330807758e-11 genextreme 0.0 gengamma 0.00696584086703 genhalflogistic 0.0 genlogistic 1.1266211972e-30 genpareto 0.0 gilbrat 1.12336984067e-66 gompertz 6.22010893728e-94 gumbel_l 0.0 gumbel_r 2.08089782821e-31 halfcauchy 0.0 halflogistic 5.08337633182e-16 halfnorm 1.52992191765e-143 hypsecant 1.63345582734e-124 invgamma 0.0 invgauss 0.000496831422071 invweibull 0.0 johnsonsb 1.53737964272e-249 johnsonsu 0.00132932660907 ksone 0.0 kstwobign 9.58783483152e-247 laplace 1.9692284069e-151 – Vitaly Isaev Nov 03 '13 at 14:05
  • loggamma 7.41642157519e-285 logistic 1.33645347244e-117 loglaplace 0.0 lognorm 1.12336984067e-66 lomax 0.0 maxwell 1.41820716349e-144 mielke 0.0 nakagami 2.5747672096e-88 nct 7.42271600686e-06 ncx2 2.12122576081e-87 norm 4.20253225349e-189 pareto 0.0 powerlaw 0.0 powerlognorm 1.12338288177e-66 powernorm 0.0 rayleigh 3.96696047832e-164 rdist 4.09139833159e-145 recipinvgauss 1.88765428707e-07 reciprocal 0.0 rice 3.93163895411e-164 semicircular 3.04723581043e-278 t 2.33354811602e-100 triang 3.93993713488e-304 truncexpon 0.0 truncnorm 0.0 – Vitaly Isaev Nov 03 '13 at 14:06
  • tukeylambda 1.2894110062e-134 uniform 8.91294425098e-321 vonmises 0.0 wald 3.69200293644e-06 weibull_max 0.0 weibull_min 6.96536022471e-14 wrapcauchy 0.0 – Vitaly Isaev Nov 03 '13 at 14:06
  • As we can see, this empirical distribution can not be fitted anyway. – Vitaly Isaev Nov 03 '13 at 14:09
  • 2
    I would not be so pessimistic. The theoretical distributions are just models of reality, that is, they are simplifications of reality. Since "simplification" is just another word for "wrong in some useful way", we would not expect a model to fit perfectly. However, this is the null hypothesis of the KS-test. So the fact that all distributions differ significantly from the theoretical ones, does not tell us anything we did not know before we started the testing, especially in such large datasets. – Maarten Buis Nov 03 '13 at 15:36
  • The real question is whether your theoretical distribution is close enough to your data for your purpose. That is just a matter of looking where the discepancies are and decide whether or not those are relevant. – Maarten Buis Nov 03 '13 at 15:41
  • My purpose is the comparing of the several empirical distributions (kind of the one being discussed here). I wanted to use parametric methods in order to estimate the significance of the distribution parameters difference. Have no idea how to check it out now. – Vitaly Isaev Nov 03 '13 at 20:18
  • 2
    "*in order to estimate the significance of the distribution parameters difference*" --- why would you do that? What's the underlying problem of interest? – Glen_b Nov 03 '13 at 21:55
  • We would like to analyse spatial patterns of points distribution that came from one spatial model. Our point of interest is to study the behavior of the one, to determine the difference of outputs ceteris paribus. – Vitaly Isaev Nov 04 '13 at 10:26