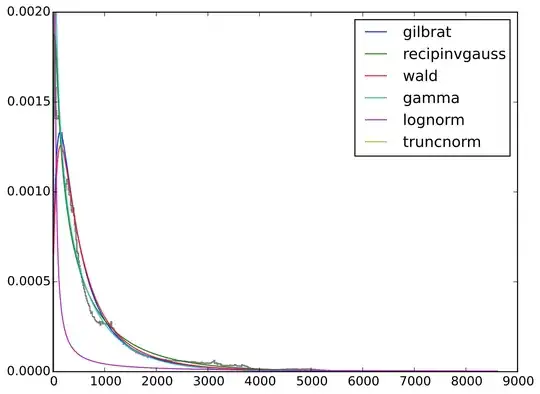
I'm trying to fit a distribution to a set of data (the elevation of all land areas in the world). The histogram shows a long-tailed distribution, and I'd like to see which of the long-tailed models describes it better. I'm running everything on Python.
This is what I am doing so far (data comes from a txt file with about 150k lines, you can get it here):
import sys, os, csv
import math as m
import numpy as np
import scipy as sp
import scipy.stats as ss
import matplotlib.pyplot as plt
import statsmodels.api as sm
from statsmodels.tools import eval_measures as em
import random


# threshold for elevation
cut = 0

# get data
os.chdir(inDir)
fname = 'elevation.txt'
fileIn = open(fname, 'r')
elev = fileIn.readlines()
elev = [float(x.strip(' \n')) for x in elev]
elev = [x for x in elev if x >= cut]
fileIn.close()
elev = np.array(elev)

# histogram
x = np.arange(min(elev), max(elev), 15) # bin size
size = len(x)
h = plt.hist(elev, bins=size, color='grey', normed=True, histtype='step')

# exogenic var for OLS (x)
exog = h[0]
dist_name = 'gamma' # also testing fo 'gilbrat', 'recipinvgauss', 'wald', 'lognorm', 'truncnorm'
dist = getattr(ss, dist_name)
param = dist.fit(elev)
pdf_fitted = dist.pdf(x, *param[:-2], loc=param[-2], scale=param[-1])

# OLS goodness of fit
# endogenic var (y)
endog = pdf_fitted
model = sm.OLS(endog, exog)
ols_fit = model.fit()
fvalue = ols_fit.fvalue
f_pvalue = ols_fit.f_pvalue
mse_model = ols_fit.mse_model
mse_resid = ols_fit.mse_resid
mse_total = ols_fit.mse_total
params_fit = ols_fit.params
pvalues = ols_fit.pvalues
rsquared = ols_fit.rsquared
resid = ols_fit.resid
rmse = em.rmse(exog,resid)
So my question is: What would be a good value to use as a measure of goodness-of-fit for each of the long-tailed models? Can I use the RMSE here? In a plot of the fitted distributions over the histogram, recipinvgauss looks really good but I'd like something more than just a visual comparison.
