4

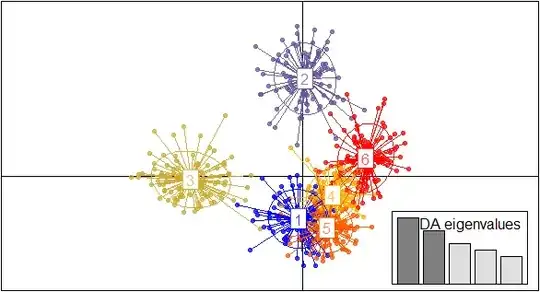
Is there a package in R that can do this plot on LDA data graph plot: enter image description here

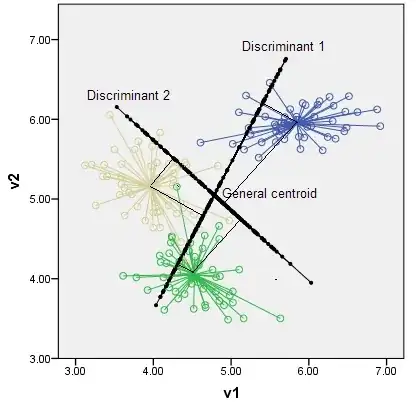
original question: How does linear discriminant analysis reduce the dimensions?

lroca
  • 187
  • 1
  • 6
  • 2
    As the one who plotted that (albeit not in `r`) I may say: if there is even no ready program, it can be written. The plot is actually a scatterplot (with spikes to group centroids) with 5 groups: 3 classes + 2 discriminant scores clouds which are straight chains when drawn in the space defined by original variables V1, V2. So, the only trick necessary to plot them is to compute coordinates of the discr. scores (which you get from LDA) onto V1, V2. The coordinate is the `score * corresponding eigenvector element`; eigenvectors of the LDA. – ttnphns Oct 30 '13 at 09:01
  • Related to http://stackoverflow.com/questions/17232251/how-can-i-plot-a-biplot-for-lda-in-r – Etienne Low-Décarie Jan 16 '14 at 16:47

1 Answers1

4

Yes, there is a package adegenet. For example:

library(adegenet)
data(dapcIllus)
x <- dapcIllus$a
grp <- find.clusters(x, max.n.clust = 40)
dapc1 <- dapc(x, grp$grp)
scatter(dapc1)

enter image description here

For more information read this.

KT12
  • 203
  • 2
  • 9
Alpha
  • 411
  • 4
  • 8