My example here may help: When making inferences about group means, are credible Intervals sensitive to within-subject variance while confidence intervals are not?
I modified the model slightly for your data. Note that with such little data your results will be heavily dependent on the priors you use so I would attempt modifying the priors on the group means and precisions (1/variance) and seeing the different results to learn.
Here are the results I got:
This is modified from John Krushke's example here:
http://psy2.ucsd.edu/~dhuber/cr_SimpleLinearRegressionRepeatedBrugs.R
He has a helpful website and blog:
http://www.indiana.edu/~kruschke/DoingBayesianDataAnalysis/
#Note. To use rjags you need to first install JAGS from here:
#http://sourceforge.net/projects/mcmc-jags/files/
install.packages("rjags") #run first time to install package
require(rjags) #load rjags package
#Format your data
subID<-rep(1:8,each=4)
dat<-rbind(88, 91, 87, 82,
81, 85, 78, 91,
75, 77, 83, 81,
92, 89, 84, 82,
78, 79, 84, 92,
89, 75, 79, 83,
91, 89, 92, 91,
87, 86, 88, 91
)
dat<-cbind(subID,dat)
colnames(dat)<-c("Subject","Value")
dat<-as.data.frame(dat)
#Jags fit function
jags.fit<-function(dat){
#Create JAGS model
modelstring = "
model{
for(n in 1:Ndata){
y[n]~dnorm(mu[subj[n]],tau[subj[n]]) T(0, )
}
for(s in 1:Nsubj){
mu[s]~dnorm(muG,tauG) T(0, )
tau[s] ~ dgamma(5,5)
}
muG~dnorm(80,.01) T(0, )
tauG~dgamma(1,1)
}
"
writeLines(modelstring,con="model.txt")
#############
#Format Data
Ndata = nrow(dat)
subj = as.integer( factor( dat$Subject ,
levels=unique(dat$Subject ) ) )
Nsubj = length(unique(subj))
y = as.numeric(dat$Value)
dataList = list(
Ndata = Ndata ,
Nsubj = Nsubj ,
subj = subj ,
y = y
)
#Nodes to monitor
parameters=c("muG","tauG","mu","tau")
#MCMC Settings
adaptSteps = 1000
burnInSteps = 1000
nChains = 1
numSavedSteps= nChains*10000
thinSteps=20
nPerChain = ceiling( ( numSavedSteps * thinSteps ) / nChains )
#Create Model
jagsModel = jags.model( "model.txt" , data=dataList,
n.chains=nChains , n.adapt=adaptSteps , quiet=FALSE )
# Burn-in:
cat( "Burning in the MCMC chain...\n" )
update( jagsModel , n.iter=burnInSteps )
# Getting DIC data:
load.module("dic")
# The saved MCMC chain:
cat( "Sampling final MCMC chain...\n" )
codaSamples = coda.samples( jagsModel , variable.names=parameters ,
n.iter=nPerChain , thin=thinSteps )
mcmcChain = as.matrix( codaSamples )
result = list(codaSamples=codaSamples, mcmcChain=mcmcChain)
}
output<-jags.fit(dat) # fit the model to your data
###make plots
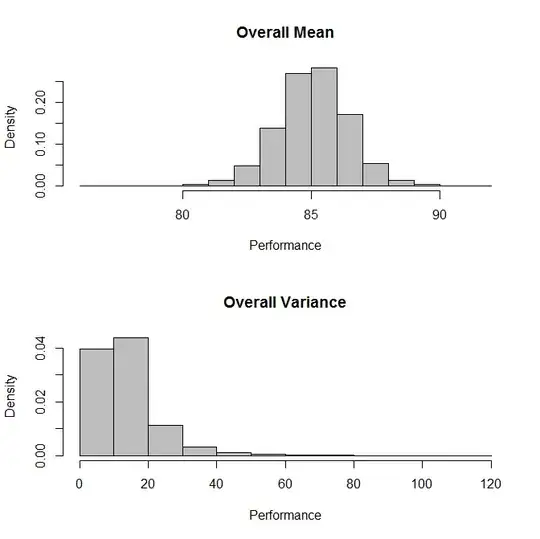
##Overall plots
par(mfrow=c(2,1))
#Plot overall means
hist(output$mcmcChain[,"muG"],col="Grey", freq=F,
main="Overall Mean", xlab="Performance"
)
#Plot overall variance
hist(1/output$mcmcChain[,"tauG"],col="Grey", freq=F,
main="Overall Variance", xlab="Performance")
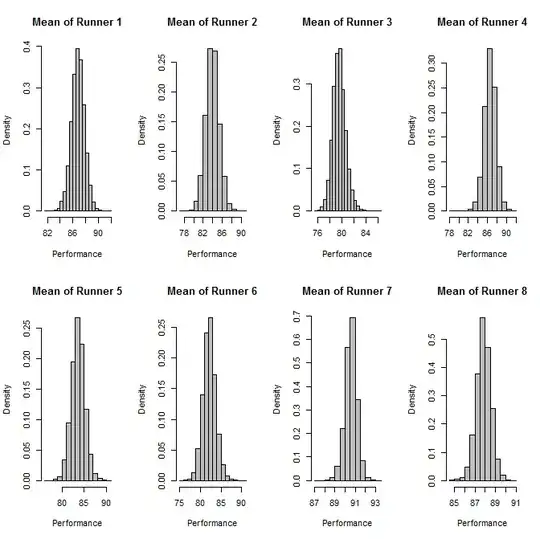
##Indidvidual Mean Plots
dev.new()
par(mfrow=c(2,4))
for(i in 1:8){
hist(output$mcmcChain[,paste("mu[",i,"]",sep="")],
main=paste("Mean of Runner", i), xlab="Performance", freq=F, col="Grey"
)
}
##Indidvidual Variance Plots
dev.new()
par(mfrow=c(2,4))
for(i in 1:8){
hist(1/output$mcmcChain[,paste("tau[",i,"]",sep="")],
main=paste("Variance of Runner", i), xlab="Performance", freq=F, col="Grey"
)
}
# see what is in the output
attributes(output$mcmcChain)
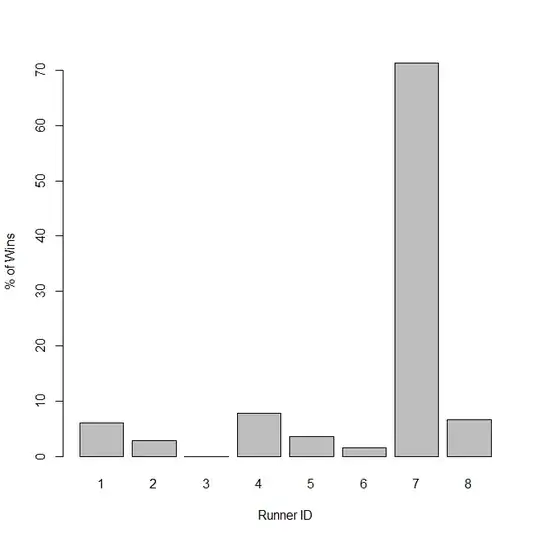
Edit:
To see the percent of time the model predicts each runner will win we can take the mean and variance estimated for each individual at each mcmc step, then sample a performance from a distribution determined by those parameters. We can then simply count the number of times each runner had the highest performance.
nSamps<-length(output$mcmcChain[,paste("mu[",i,"]",sep="")])
out=matrix(nrow=nSamps*8,ncol=3)
cnt<-1
for(j in 1:nSamps){
for(i in 1:8){
m<-output$mcmcChain[,paste("mu[",i,"]",sep="")][j]
v<-1/output$mcmcChain[,paste("tau[",i,"]",sep="")][j]
t<-rnorm(1,m,sqrt(v))
out[cnt,]<-cbind(j,i,t)
cnt<-cnt+1
}
}
colnames(out)<-c("N","RunnerID","Time")


winners=matrix(nrow=nSamps,ncol=1)
for(i in 1:nSamps){
sub<-out[which(out[,"N"]==i),]
winners[i]<-sub[which(sub[,"Time"]==max(sub[,"Time"])),"RunnerID"]
}

dev.new()
barplot(100*table(winners)/nSamps, xlab="Runner ID", ylab="% of Wins")