0

I have a data frame with the following:

> summary(d5$points)
   Min. 1st Qu.  Median    Mean 3rd Qu.    Max. 
 -4.200   0.000   1.000   2.579   5.000  23.400 

> sd(d5$points)
[1] 3.736616

What's a simple, but statistically sound way to categorize this data into terrible, poor, average, good, excellent.

I'm using R.

Edit:

Higher is points is better. Negative points is terrible. A good game would be a player scoring 6+ points, but that's just from my observations.

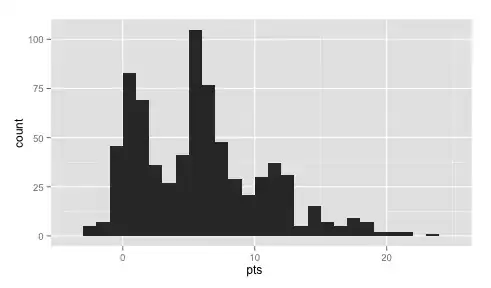
As requested, are are the histograms.

All Players

Histogram of all players

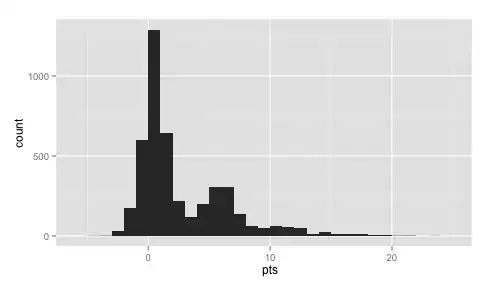
Top 100 Players (based on their avg points)

Histogram of the best players

Bradford
  • 173
  • 9
  • It is not really clear what you are asking. You could start by telling us what you would consider "bad" and "good" data... – nico Oct 22 '13 at 12:40
  • 2
    What's the point of categorizing it? For statistical analysis that would generally be a bad thing to do; for simple description there's no sound or unsound way from a purely statistical perspective - it depends on the meaning of the data (are higher/lower values better?). And what's it got to do with factor analysis? – Scortchi - Reinstate Monica Oct 22 '13 at 12:41
  • @nico that's what I'm asking. How do I determine what's good and bad, based just on the data? – Bradford Oct 22 '13 at 12:44
  • 2
    Round to the nearest whole number, then even numbers are good, odd numbers are bad. – Scortchi - Reinstate Monica Oct 22 '13 at 12:45
  • @Scortchi I'm using it to classify data for NaiveBayes. In R, this is called a factor, so I just assumed it was related. Since you asked the question, I assume it is now not related at all. Edit: These are points assigned to a player. Higher is better. Negative is `terrible`. – Bradford Oct 22 '13 at 12:46
  • 3
    Sounds like a bad idea to be using any kind of classifier when the data is in fact continuous - see [here](http://stats.stackexchange.com/questions/68834/what-is-the-benefit-of-breaking-up-a-continuous-predictor-variable/68839). But people who insist on doing that typically do it either using meaningful cut-offs or equally sized bins. – Scortchi - Reinstate Monica Oct 22 '13 at 12:55
  • @Scortchi thanks a lot. This is why I asked. I have no idea what I'm doing :) – Bradford Oct 22 '13 at 13:05
  • 1
    @Scortchi there are exceptions from `even numbers are good, odd numbers are bad` rule. E.g. `666` is terrible, `7` is excellent, etc etc – ttnphns Oct 22 '13 at 13:14
  • 3
    Even if you do succeed in categorizing these numbers into five groups, that cannot (of itself) tell you *anything* about whether they are "terrible," "excellent," or anything in between: those are *value judgments* that cannot be determined solely from a bunch of numbers. – whuber Oct 22 '13 at 13:21
  • Please at least tell people which direction (positive or negative) is considered good. – Penguin_Knight Oct 22 '13 at 13:48
  • 1
    If that's all the data you have, then it would just be misleading to categorise it, the figures would speak for themselves in conjunction with your statement, that higher is better than lower. You may also consider stating what your expected average is (it might or might not be zero) and what you think is acceptable. – Robert Jones Oct 22 '13 at 13:49
  • There are a lot of measurement questions that come to mind, and some interesting exercises in probability or the polytomous Rasch model, but You haven't stated your research question clearly enough to guide us to what use you wish to make of your data. What is the information you wish to give to your audience, and what is your clear research question? – doug.numbers Oct 22 '13 at 19:24
  • @doug.numbers I have game logs for all players (including the strengths of their opponents). I then have a schedule for tomorrow's game with the same opponent facts. I want to know which players are going to give me the most points (with an estimate of the points they will yield). I was interested in seeing if a classifier will help me solve this. – Bradford Oct 22 '13 at 21:42
  • "Which players will give me the most points" is quite different from 'categorize points data'. It sounds to me like (assuming you have individual match data on who has played whom and who got what points from it) you might use something like a Bradley-Terry model, but there's not enough data here to say much of anything. – Glen_b Oct 22 '13 at 22:28

1 Answers1

1

Apply a Box-Cox transformation. Then use the following :

  1. x < mean - 2 * sigma : terrible
  2. mean - 2 * sigma <= x < mean - sigma : poor
  3. mean - sigma <= x < mean + sigma : average
  4. mean + sigma <= x < mean + 2 * sigma : good
  5. mean + 2 * sigma <= x : excellent.

in absence of any other information, i would go this away. however at least a histogram could have been given.

htrahdis
  • 638
  • 5
  • 5
  • 2
    You could do this and it is "objective". Put on the other side all the comments implying that you are degrading your data unnecessarily and arbitrarily. – Nick Cox Oct 22 '13 at 14:32
  • @NickCox: this would work well with a normal(-ish) distribution of the data, which looking at the histogram seem not really to be the case. That said, I think the trick here is just to be consistent. This **is** an arbitrary classification. There is no statistical reason to choose 2 sigma over 2.5 or 3. And to use mean and not median. However, as long as you always use this then you are fine. If you define terrible as "< mean-2*sigma" than that is terrible. If I define it as " – nico Oct 22 '13 at 16:20
  • 1
    @nico A Box-Cox transformation is being recommended as a prerequisite. Why do this at all? remains my reaction, and several of us are singing the same song. – Nick Cox Oct 22 '13 at 16:39