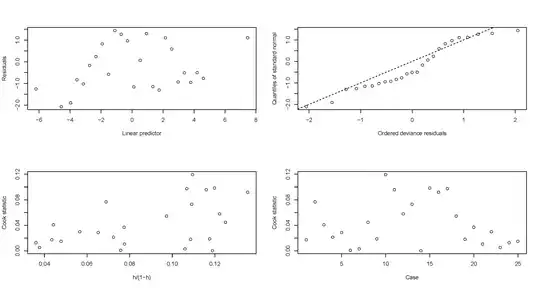
You should plot your residuals vs. explanatory variables (i.e. $X_i$'s) and residuals vs. fitted values to see if there is anything wrong with the model. There are other diagnostic plots. In R you can use function glm.diag.plots in package boot. See the code below and also this post. Here I will also use package Mass to load a data.
library(MASS)
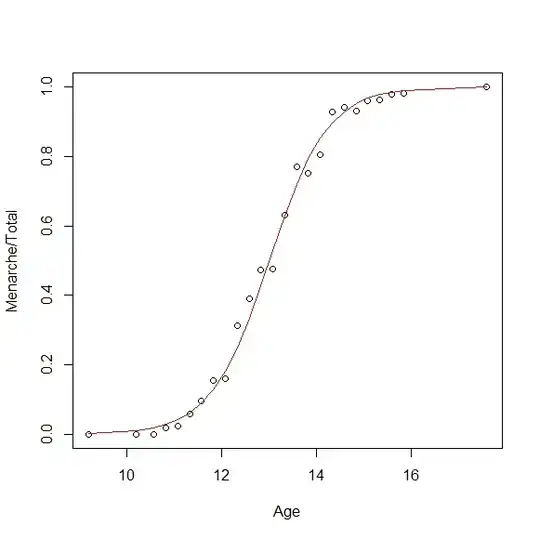
data(menarche)
plot(Menarche/Total ~ Age, data=menarche)
glm.out = glm(cbind(Menarche, Total-Menarche) ~ Age,family=binomial(logit), data=menarche)
library(boot)
glm.diag.plots(glm.out)
And to have some more fun with the fitted values:
plot(Menarche/Total ~ Age, data=menarche)
lines(menarche$Age, glm.out$fitted, type="l", col="red")