I am going to base my answer in general and insert comments as to how your problem fits into the testing framework. In general, we can test for equality of proportions using a $\chi^2$ test where the typical null hypothesis, $H_0$, is the following:
$$H_0:p_1=p_2=...=p_k$$
i.e., all of the proportions are equal to each other. Now in your case you null hypothesis is the following:
$$H_0:p_1=p_2=p_3$$
and the alternative hypothesis is
$$H_A:\text{ at leat one }p_i\text{ is different for }i=1,2,3$$
Now in order to carry out the $\chi^2$ test we need to calculate the following test statistic:
The value of the test-statistic is
$$\chi^2=\sum_{i=1}^n\frac{(O_i-E_i)^2}{E_i}$$
where
- $\chi^2$ = Pearson's cumulative test statistic, which asymptotically approaches a $\chi^2$ distribution
- $O_i$ = the observed frequency
- $E_i$ = an expected (theoretical) frequency, asserted by the null hypothesis
- $n$ = the number of cells in the table
In your case $n=6$ since we can think of this problem as being the following table:
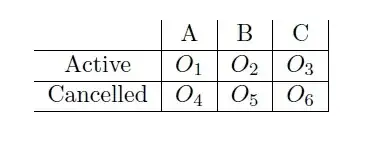
Now once we have the test statistic we have two options of how to proceed to complete our hypothesis testing.
Option 1) We can compare our test static $\chi^2$ to the appropriate critical value under the null hypothesis. That is to say, if $H_0$ is true, then a $\chi^2$ statistic from a contingency table with $R$ rows and $C$ columns should have a $\chi^2$ distribution with $(R-1)\times(C-1)$ degrees of freedom. After calculating our critical value $\chi^*$ if we have that $\chi^2>\chi^*$ then we will reject the null hypothesis. Obviously if $\chi^2\leq\chi^*$ then we fail to reject the null hypothesis.
Graphically (all of the numbers are made up) this is the following:
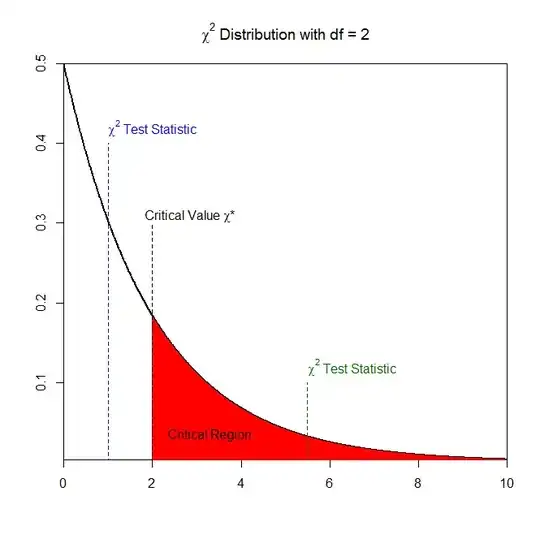
From the graph, if our test statistic $\chi^2$ correspond to the blue test statistic then we would fail to reject the null hypothesis since this test statistic does not fall inside the critical region (i.e., $\chi^2<\chi^*$). Alternatively, the green test statistic does fall inside the critical region and so we would reject the null hypothesis had we calculated the green test statistic.
In your example, your degrees of freedom are equal to
$$df = (R-1)\times(C-1)=(2-1)\times(3-1)=1\times2=2 $$
Option 2) we can calculate the p-value associated withe the test statistic under the null hypothesis and if this p-value is less than then some specified $\alpha$-level then we can reject the null hypothesis. If the p-value is greater than the $\alpha$-level then we fail to reject the null hypothesis. Note that the p-value is the probability that a $\chi^2_{(R-1) \times(C-1)}$ distribution is greater than the test statistic.
Graphically we have that
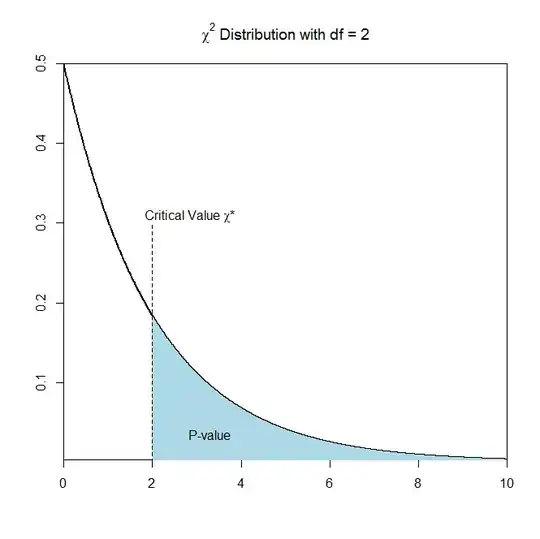
where the p-value is calculated as the area that is greater than our test statistic (the blue shaded area in the example).
So, if $\alpha>\text{p-value}$ then fail to reject the null hypothesis $H_0$, else,
if $\alpha\leq\text{p-value}$ the reject the null hypothesis $H_0$