I have dendrogram and a distance matrix. I wish to compute a heatmap -- without re-doing the distance matrix and clustering.
Is there a function in R that permits this?
I have dendrogram and a distance matrix. I wish to compute a heatmap -- without re-doing the distance matrix and clustering.
Is there a function in R that permits this?
I don't know a specific function for that. The ones I used generally take raw data or a distance matrix. However, it would not be very difficult to hack already existing code, without knowing more than basic R. Look at the source code for the cim() function in the mixOmics package for example (I choose this one because source code is very easy to read; you will find other functions on the Bioconductor project). The interesting parts of the code are l. 92-113, where they assign the result of HC to ddc, and around l. 193-246 where they devised the plotting regions (you should input the values of your distance matrix in place of mat when they call image()). HTH
Edit
A recent Google search on a related subject lead me to dendrogramGrob() from the latticeExtra package. Assuming you already have your sorted dendrogram object, you can skip the first lines of the example code from the on-line help and get something like this (here, with the mtcars dataset):
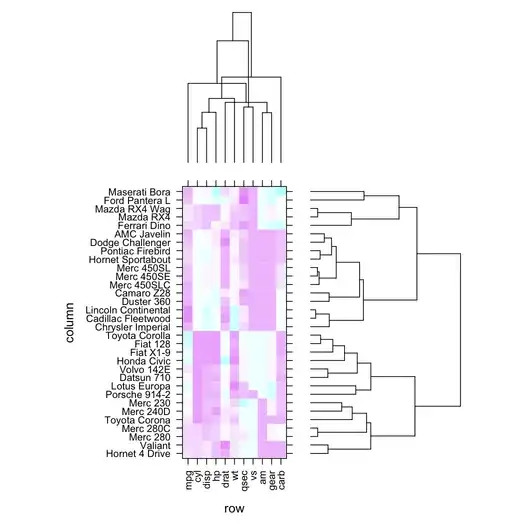
Assuming you also have the raw data, you can use function heatmap(). It can take one or two dendrograms as input, if you want to avoid calculating the distances and clustering the objects again.
Let's first simulate some data:
set.seed(1)
dat<-matrix(ncol=4, nrow=10, data=rnorm(40))
Then cluster the rows and columns:
rd<-dist(dat)
rc<-hclust(rd)
cd<-dist(t(dat))
cc<-hclust(cd)
After this we have
1) the raw data (dat) 2) a distance matrix (rd) and a dendrogram (rc) for rows of the raw data matrix 3) a distance matrix (cd) and and a dendrogram (cc) for columns of the raw data
Distance matrices are not actually needed for the further steps, but the raw data on which the clustering was performed, and the resulting dendrogram(s) are.
With the raw data these dendrograms can be used as input to the function heatmap(). If both row and column dendrograms are needed, use:
heatmap(dat, Rowv=as.dendrogram(rc), Colv=as.dendrogram(cc))
If only row or column dendrogram is needed, use NA as an input for either Rowv or Colv parameter in heatmap():
# Dendrogram for rows only
heatmap(dat, Rowv=as.dendrogram(rc), Colv=NA)
# Dendrogram for columns only
heatmap(dat, Rowv=NA, Colv=as.dendrogram(cc))