14

Can you give the reason for using a one tailed test in the analysis of variance test?

Why do we use a one-tail test - the F-test - in ANOVA?

amoeba
  • 93,463
  • 28
  • 275
  • 317
Cynderella
  • 245
  • 1
  • 2
  • 8
  • 3
    Some questions to guide your thinking... What does a very negative t statistic mean? Is a negative F statistic possible? What does a very low F statistic mean? What does a high F statistic mean? – russellpierce Aug 16 '13 at 06:41
  • Why are you under the impression that a one-tailed test has to be an F-Test? To answer your question: The F-Test allows to test a hypothesis with more than one linear combination of parameters. – IMA Aug 16 '13 at 07:17
  • 1
    Do you want to know why one would use a one-tailed instead of a two-tailed test? – Jens Kouros Aug 16 '13 at 07:53
  • @tree what constitutes a credible or official source for your purposes? – Glen_b Oct 27 '13 at 23:24
  • @tree Incidentally, an explanation of why is already given in the last paragraph of [this answer](http://stats.stackexchange.com/a/56797/805). I would expand on that answer in detail but I doubt that meets your criteria of 'credible or official', whatever that means. – Glen_b Oct 27 '13 at 23:26
  • @Glen_b Suppose my alternative hypothesis $H_a:\sigma^2\ne0$. And in that case isn't the rejection region in both right and `left` tail ? I am asking the question according to your reference of last comment. – time Oct 28 '13 at 16:23
  • 1
    @tree note that Cynderella's question here is *not* about a test of variances, but specifically an F-test of ANOVA - which is a test for *equality of means*. If you're interested in tests of equality of variances, that's been discussed in many other questions on this site. (For the variance test, yes, you do care about both tails, as is clearly explained in the last sentence of [this section](http://en.wikipedia.org/wiki/F-test_of_equality_of_variances#The_test), right above '**Properties**') – Glen_b Oct 28 '13 at 22:25
  • In any case, you can reject the null you specified there as soon as your sample has nonzero variance, since if the sample has nonzero variance, the population must. I suspect you meant to write something else there. – Glen_b Oct 28 '13 at 22:54
  • Maybe this can help: http://stats.stackexchange.com/questions/171074/chi-square-test-why-is-the-chi-squared-test-a-one-tailed-test/171084#171084 –  Nov 23 '15 at 05:06

3 Answers3

19

F tests are most commonly used for two purposes:

  1. in ANOVA, for testing equality of means (and various similar analyses); and

  2. in testing equality of variances

Let's consider each in turn:

1) F tests in ANOVA (and similarly, the usual kinds of chi-square tests for count data) are constructed so that the more the data are consistent with the alternative hypothesis, the larger the test statistic tends to be, while arrangements of sample data that looks most consistent with the null corresponds to the smallest values of the test statistic.

Consider three samples (of size 10, with equal sample variance), and arrange them to have equal sample means, and then move their means around in different patterns. As the variation in the sample means increases from zero, the F statistic becomes larger:

Arrangements of 3 samples and corresponding F statistic

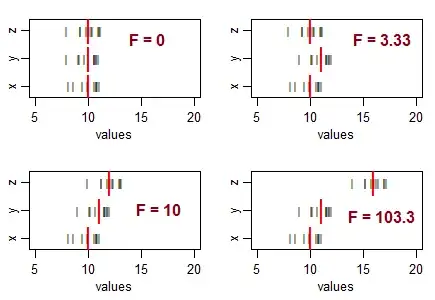
The black lines ($^{\:_|}$) are the data values. The heavy red lines ($\color{red}{\mathbf{|}}$) are the group means.

If the null hypothesis (equality of population means) were true, you'd expect some variation in sample means, and would typically expect to see F ratios roughly around 1. Smaller F statistics result from samples that are closer together than you'd typically expect ... so you aren't going to conclude the population means differ.

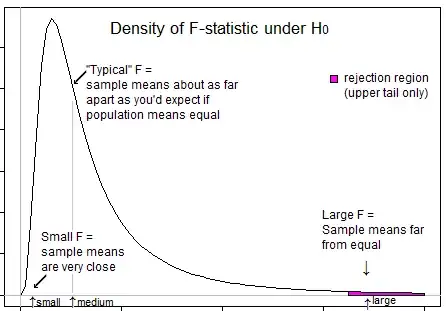
That is, for ANOVA, you'll reject the hypothesis of equality of means when you get unusually large F-values and you won't reject the hypothesis of equality of means when you get unusually small values (it may indicate something, but not that the population means differ).

Here's an illustration that might help you see that we only want to reject when F is in its upper tail:

Description of F for ANOVA, reject when F-statistic is in upper tail

2) F tests for equality of variance* (based on variance ratios). Here, the ratio of two sample variance estimates will be large if the numerator sample variance is much larger than the variance in the denominator, and the ratio will be small if the denominator sample variance is much larger than variance in the numerator.

That is, for testing whether the ratio of population variances differs from 1, you'll want to reject the null for both large and small values of F.

* (Leaving aside the issue of the high sensitivity to the distributional assumption of this test (there are better alternatives) and also the issue that if you're interested in suitability of ANOVA equal-variance assumptions, your best strategy probably isn't a formal test.)

Glen_b
  • 257,508
  • 32
  • 553
  • 939
  • Good answer. Curious what test you'd consider a better alternative for testing equal variances (in general). – TLJ Oct 29 '13 at 04:08
  • 2
    @TaylerJones Levene's test is somewhat more robust. Browne-Forsythe is more robust (but loses a little power near the normal). Fligner-Killeen more so again. In several decades, I've used Levene or Browne-Forsythe no more than twice each. (If it came up again, likely something like Browne-Forsythe would suit me fine but I don't generally have situations where it makes any sense to test several groups variances for equality.) – Glen_b Oct 29 '13 at 07:34
  • 2
    I appology. I still haven't understood why do we use one-tail in *ANOVA* . More specifically, from your discussion i understood that under null hypothesis i would not have any treatment effect and consequently $F=\frac{MS_{TREATMENT}}{MS_{ERROR}}$ will be close to $1$ , while if alternative hypothesis is true the $F$-Ratio will be larger. But how does it imply *"that is the reason for using one-tail test in ANOVA?"* – time Oct 29 '13 at 12:18
  • 2
    @tree it sounds like you don't understand something about hypothesis testing more generally, but it's hard to be certain exactly where. You say you understand that if you get a large F you want to reject and if you get a small F you don't want to reject. The large values of F are those values in the upper tail while small values of F are those values in the lower tail. You only want to reject when the values are large ... i.e. in the upper tail, but not the lower tail. How can you not see that's one tailed? I'll include another plot that might help. – Glen_b Oct 29 '13 at 22:03
  • Now it is clear. This is really an excellent explanation. Also your last comment. – time Oct 30 '13 at 00:35
  • @tree when doing an F-test hypothesis test for variance (F test's most common use), you generally always put the larger variance on top and treat it as a one tail. However, when doing ANOVA, MS(Tr) is always on top. While a value between 0 and 1 is possible, it is the same as 1 in the sense that it indicates that MS(Tr) has equal or less variance than MS(Error) and is thus not significant. – TLJ Oct 31 '13 at 22:57
  • Note that if you do the 'put the larger variance on top' in a variance test, the significance level is effectively double the upper tail area associated with your critical value. – Glen_b Oct 31 '13 at 23:47
  • In R, a number of homogeneity of variance tests are using the one-tailed test. For example, with R's Brown-Forsythe, which uses the F-Test, when I look at the p-values they assign to the calculated F-values, and compare that with one-tailed F-Distribution tables, it's clear they are using one-tailed tests (almost all of these tables in the back of textbooks are one-tailed, since ANOVA is typically interpreted as one-tailed, and they presume students will be using these to test their ANOVA F-values).. SPSS does the same for Levene's, the only HOV test it provides--its very disturbing. – jeramy townsley Nov 23 '15 at 03:52
  • 1
    @jeramy My comments refer to the tests that rely on ratios of variances (specifically, I stated "*Here, the ratio of two sample variance estimates will* ..."). The tests you refer to look for location differences in absolute residuals from some location measure in order to spot differences in spread; they naturally work the way tests for location-differences work. Since I was trying to show a case where you *would* look at the lower tail of the F, the Brown-Forsythe (& some other tests that look for location differences in some measure of deviation to infer spread differences) would be no help – Glen_b Nov 23 '15 at 04:03
  • 1
    @jeramy I have added a few words to make it more explicit. You may like to note that even though Brown-Forsythe, Levene and so on *use* F-tables, the distribution of the test statistics are not actually F-distributed, even under the assumptions of the test. – Glen_b Nov 23 '15 at 04:05
2

It must be understood that the objective of ANOVA is to check whether there is inequality of means...which implies that we are concerned with large variations between samples (& thus means as variations are computed from the means) as compared with variations within samples (again computed from individual sample mean). When the variations between samples is small (resulting in F value being on the left side) it does not matter as this difference is insignificant. The variations between samples matters if it is significantly higher than the within variations & in such case the F value would be greater than 1, & therefore in the right tail.

The only question remains is why put the entire level of significance in the right tail & the answer is again similar. THe rejection happens only when the F ratio is on the right side & never when the F ratio is on the left side. The level of significance is the measure of error due to statistical limitations. As the rejection happens only on the right the entire level of significance (error risk of misconclusion) is kept in the right. `

Glen_b
  • 257,508
  • 32
  • 553
  • 939
0

The expected value for the Mean Square (MS) within treatments is the population variance, whereas the expected value for the MS between treatments is the population variance PLUS the treatment variance. Thus, the ratio of F = MSbetween / MSwithin is always greater than 1, and never less than 1.

Since the precision of a 1-tailed test is better than a 2-tailed test, we prefer to use the 1-tailed test.

  • I don't believe the claim in the last sentence of your first paragraph is correct... E(numerator) > E(denominator) does not imply that numerator > denominator. – Glen_b Nov 06 '15 at 00:17
  • Aside from Glen_b's point, I'm not sure about "since the precision of a 1-tailed test is better than a 2-tailed test, we prefer to use the 1-tailed test." Can you explain what you mean by this? Talking about precision seems to me to miss the point. – Silverfish Nov 06 '15 at 00:19
  • Precision is same as half confidence interval. For the same F-stat, a 1 tail test will reject the null hypothesis with a smaller p-value (half, in fact). The other way around, a 1 tail test can reject the null hypothesis with smaller values of the F-stat. This implies that a 1 tail test can detect a treatment effect with fewer samples or with more common cause variance present in the sample. This makes the 1 tail test more desirable, if one is looking for an effect. – Jeff Cotter Nov 06 '15 at 01:23
  • Yes, a calculated F statistic can be less than 1.0. However, the conclusion would be fail to reject the null hypothesis of "no treatment effects". Therefore, there's no critical region in the lower tail. Therefore, the F-test is an upper one-tailed test. In ANOVA, the logical argument is based on the expected values for MS_treat and MS_error. Under the "no treatment effect" hypothesis, H0: E(MS_treat) = E(MS_error) = population variance. Any significant treatment effect results in HA: E(MS_treat) > E(MS_error). (Source any Montgomery text covering ANOVA). Thus, HA implies a one-tailed test. – Jeff Cotter Nov 06 '15 at 01:30