7

I'm reading a paper that does not report the coefficients from two OLS regressions. In both cases there is 1 response variable and 1 predictor variable. The predictor variable is the same in both cases. I know the subject matter of the paper well, which leads me to believe that the means of the slopes are almost certainly between 0 and 1. Although the slopes for these two regressions are not reported, the author does report that neither slope is significantly different from 0 (p ≥ 0.05).

If neither slope is different from 0, but both slopes are between 0 and 1, could the slopes be different from each other?

To try to figure this out, I did a quick test in R. I used two slopes that were very different (0.99 and 0.01), but chose s.e.'s for each that would make them barely "insignificant". To compare the slopes, I used the formula from the answer to THIS question.

pnorm( 
  (0.99 - 0.01)/ #difference between means
  sqrt(0.61^2 + 0.0062^2), #sqrt of sum squares of s.e.'s
  lower.tail=FALSE
)

OK, so this quick-and-dirty test suggests that the two slopes in the author's analysis can't be different.

Is it necessarily true that if two slopes are between 0 and 1, and neither different from 0, that they cannot be significantly different from each other?
rbatt
  • 739
  • 1
  • 8
  • 20

1 Answers1

5

It depends on how you do the testing. For instance, consider this model for the three variables $x$, $y_0$, and $y_1$:

$$\cases{ \mathbb{E}[y_0] = \beta_{0} + \beta_{1}x \\ y_1 = y_0 + \gamma x }$$

where $\beta_0$, $\beta_1$, and $\gamma$ are parameters and $\gamma$ is the difference in slopes. Evidently

$$ \mathbb{E}[y_1] = \mathbb{E}[y_0 + \gamma x] = (\beta_{0} + \beta_{1}x) + \gamma x = \beta_0 + \beta_2 x$$

with $\beta_2 = \beta_1 + \gamma$. Then it is possible for estimates $\widehat{\beta}_1$ and $\widehat{\beta}_2$ to be indistinguishable from zero while determining, via regressing $y_1-y_0 = \gamma x$ against $x$, that $\widehat{\gamma}$ differs significantly from zero. The key idea is that $y_1$ and $y_0$ are not independent.


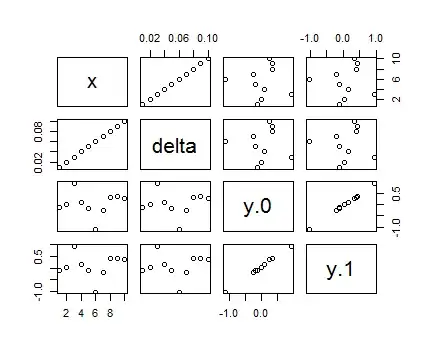
As an example here are simulated data in R:

n <- 10
x <- 1:n
delta <- x / n^2
y.0 <- residuals(lm(rnorm(n) ~ x)) + delta/2
y.1 <- y.0 + delta
pairs(cbind(x, delta, y.0, y.1))

Scatterplot matrix

Neither of the regressions $y_i \sim x$ is significant ($\widehat{\beta}_0 = 1/200,$ $p=0.937$ and $\widehat{\beta}_1 = 3/200$, $p=0.812$):

> summary(lm(y.0 ~ x))

            Estimate Std. Error t value Pr(>|t|)
(Intercept)  0.00000    0.37903   0.000    1.000
x            0.00500    0.06109   0.082    0.937

> summary(lm(y.1 ~ x))

             Estimate Std. Error t value Pr(>|t|)
(Intercept) 5.266e-17  3.790e-01   0.000    1.000
x           1.500e-02  6.109e-02   0.246    0.812

The regression of $y_1 - y_0 \sim x$ is extremely significant ($\widehat{\gamma} = 1/100,$ $p \lt 2\times 10^{-16}$):

> summary(lm((y.1 - y.0) ~ x))

             Estimate Std. Error   t value Pr(>|t|)    
(Intercept) 2.633e-17  1.415e-17 1.860e+00   0.0999 .  
x           1.000e-02  2.281e-18 4.384e+15   <2e-16 ****
whuber
  • 281,159
  • 54
  • 637
  • 1,101
  • Just to be sure I get the idea, you're saying that the slopes could be different if the y-axes in the two regressions are correlated, right? Thanks a ton for the answer, this is definitely a good piece of information to keep in mind! – rbatt Aug 13 '13 at 20:04
  • 1
    I *think* I can agree with that, provided we understand "y-axes" to mean "dependent variables." This phenomenon is akin to the difference between an unpaired and paired t-test: the test in your question is a legitimate one, analogous to an unpaired t-test, but it lacks power to detect true differences in slope when the variables are (conditionally) positively correlated. Testing the slope of the regressed *difference* is the analog of performing a t-test of a difference of paired variables to see whether it is zero. – whuber Aug 13 '13 at 20:07
  • That is what I meant, thanks for the additional explanation :) – rbatt Aug 13 '13 at 20:46