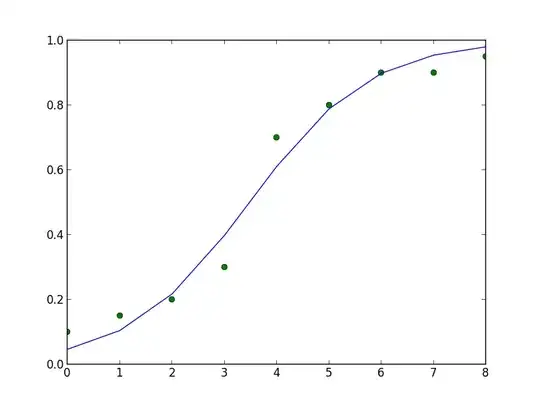
I have some 2d data that I believe is best fit by a sigmoid function. I can do the fitting with the following python code snippet.
from scipy.optimize import curve_fit
ydata = array([0.1,0.15,0.2,0.3,0.7,0.8,0.9, 0.9, 0.95])
xdata = array(range(0,len(ydata),1))

def sigmoid(x, x0, k):
    y = 1 / (1+ np.exp(-k*(x-x0)))
    return y

popt, pcov = curve_fit(sigmoid, xdata, ydata)
However, I'd like to use a maximum likelihood approach so I can report likelihoods. I think it's possible do to this using the statsmodels package, but I can't figure it out. Any help would be appreciated.
Update:
I think the approach may be to redifine the likelihood function as it is described here:
http://statsmodels.sourceforge.net/devel/examples/generated/example_gmle.html
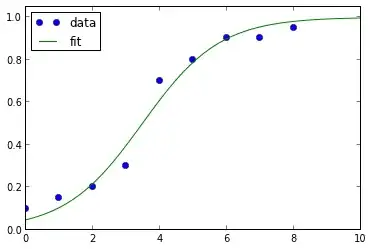
The plot of the above code snippet looks like this:
Update 2:
Here's how to do it in R:
require(bbmle)

# this sigmoid function is used to make some fake data
rsigmoid <- function(y1,y2,xi,xmid,w){
   y1+(y2-y1)/(1+exp((xmid-xi)/w))
}
counts <- round(rsigmoid(0, 1, 1:100+rnorm(100,0,3), 50, 10)*20,0)

# NOTE THAT THE SIGMOID FUNCTION IS REDEFINED AS AN R FORMULA
fit_sigmoid <- mle2(P1 ~ dbinom(prob=y1+(y2-y1)/(1+exp((xmid-xi)/w)), size=N),
             start = list(xmid=50, w=10),
             data=list(y1=0, y2=1, N=20, P1=counts, xi=1:100),
             method="L-BFGS-B", lower=c(xmid=1,w=1e-5), upper=c(xmid=100,w=100))