4

I'm trying to understand the effects of the explanatory variables of my logit regression.

(Intercept)    -6.7909619  0.0938448 -72.364  < 2e-16 ***                       
level           0.0755949  0.0192928   3.918 8.92e-05 ***                       
building.count  0.0697849  0.0091334   7.641 2.16e-14 ***                       
gold.spent      0.0019825  0.0001794  11.051  < 2e-16 ***                       
npc             0.0171680  0.0056615   3.032  0.00243 **                        
friends         0.0304137  0.0044568   6.824 8.85e-12 ***                       
post.count     -0.0132424  0.0041761  -3.171  0.00152 ** 

But when I look at the raw data, I don't understand why post.count is negatively effects my output. And also post.count and my dependent variable (revenue.all.time) has small but positive correlation:

> with(sn, cor(post.count, revenue.all.time))
[1] 0.009806015

I also checked the correlations between post.count variable and the others:

> with(sn, cor(post.count, gold.spent))
[1] 0.296514
> with(sn, cor(post.count, level))
[1] 0.4289456
> with(sn, cor(post.count, building.count))
[1] 0.4140521
> with(sn, cor(post.count, npc))
[1] 0.3370106
> with(sn, cor(post.count, friends))
[1] 0.007695264

but they're all positive as well. So why does my model denote post.count's coefficient negative ?

Thanks,
CanCeylan
  • 259
  • 2
  • 3
  • 9
  • 2
    it would be more helpful to figure out if you also gave us correlation between explanatory variables – Metrics Jul 24 '13 at 17:53

2 Answers2

6

The interpretation of the post.count coefficient is that it gives the relationship with the response variable, all other factors being held constant. What can be happening is that the marginal effect of post.count is being taken up by one or more of the other variables (let's say building.count for definiteness). As building.count increases, so does revenue. However, for a given level of building.count, there is a small but sure decrease in revenue with post.count. In other words, the marginal relationship you saw for post.count was really due to building.count, and including that variable in the analysis brought that out.

To get this effect, there has to be positive correlation between the two predictors involved, as you have.

Here's an example from my own experience (insurance risk). The claim rate for motor insurance is positively correlated with year of manufacture: more recently-built cars have more claims. It's also positively correlated with sum insured: more expensive cars have more claims. However, when you include both predictors, you find that claim rate has a negative relationship with year of manufacture: for a given value, more recently-built cars have fewer claims than earlier ones. This is because for a given value, an older car is likely to be an inherently more prestigious/higher-status make or model which has suffered the effects of depreciation. On the other hand, a newer vehicle insured for the same amount is likely to be a more mass-market brand. Pricier, more valuable brands are more likely to claim, and this is brought out when both effects (vehicle age and sum insured) are included in the analysis.

Hong Ooi
  • 7,629
  • 3
  • 29
  • 52
  • If the positive correlations are large between the predictors, then it would be good to remove one of them. – NebulousReveal Jul 24 '13 at 17:56
  • @guest43434 Not necessarily. A strong correlation between x1 and x2 doesn't rule out _both_ x1 and x2 having strong individual relationships with y. – Hong Ooi Jul 24 '13 at 17:57
  • In terms of model selection, I think it is best to remove collinear variables: http://en.wikipedia.org/wiki/Multicollinearity – NebulousReveal Jul 24 '13 at 18:00
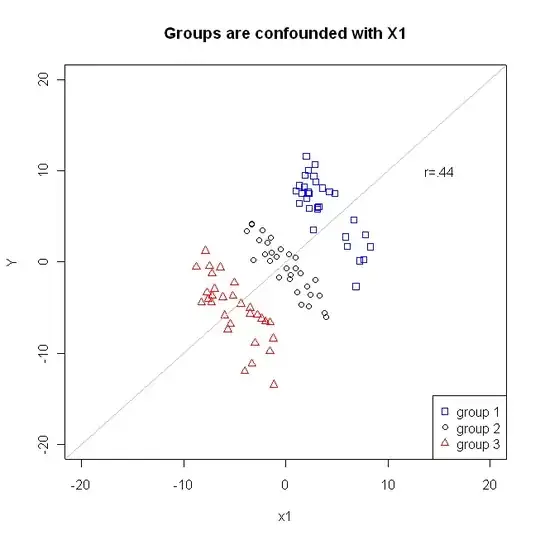
  • @guest43434 No. See the graph that AO helpfully provided, which says essentially the same thing as I've been saying. – Hong Ooi Jul 24 '13 at 18:08
  • 1
    If you look at the graph of the data as a whole without regard to group membership, then the correlation is positive. Looking at each group individually (fixing the other groups) produces negative coefficients. If there was perfect collinearity between group 2 and group 1 (i.e. $\text{group 2} = \lambda_0+\lambda_{1} \cdot \text{group 1}$) then wouldn't we want to remove one of them? – NebulousReveal Jul 24 '13 at 18:19
  • @guest43434 Collinearity is a statistical problem. _Perfect_ collinearity is a _mathematical_ problem. Do not confuse the two. – Hong Ooi Jul 24 '13 at 18:42
  • 1
    I am not confusing the two. We would say that group 1 and group 1 are collinear if $\text{group 2} = \lambda_0 +\lambda_{1} \cdot \text{group 1} + \varepsilon$ where $\varepsilon$ is some noise. If $\varepsilon$ is sufficiently small, then we would want to remove one the variables. – NebulousReveal Jul 24 '13 at 18:46
  • @guest43434 Exactly. When you introduce noise, you no longer have perfect collinearity. The problem with _perfect_ collinearity is that it makes solving the normal equations for the regression coefficients impossible. This is why we remove them, and why most software procedures can detect and set confounded coefficients to NA or zero. This is entirely separate to the problem of interpreting relationships when variables are _not_ perfectly collinear. – Hong Ooi Jul 24 '13 at 18:52
  • Or, if you insist on letting Wikipedia do your thinking for you: see [Simpson's paradox](http://en.wikipedia.org/wiki/Simpson%27s_paradox). – Hong Ooi Jul 24 '13 at 18:54
  • I doubt that *perfect* collinearity is ever observed in real-world datasets. As far as I know, even non-perfect collinearity can lead to problems in statistical analyses (both computational and interpretation-wise). There are several measures to detect multicollinearity, such as the variance inflation factor or the [condition number](http://stats.stackexchange.com/questions/56645/what-is-the-fastest-method-for-determining-collinearity-degree). There are [many posts](http://stats.stackexchange.com/questions/tagged/multicollinearity) on the site concerning collinearity which may be helpful. – COOLSerdash Jul 24 '13 at 19:38
  • Actually, perfect collinearity is observed all the time: whenever we have nominal variables, basically. Mostly the software handles this behind the scenes, but with sufficiently complex nested/interactive designs, or careless coding, you can see still NA's popping up. The point, though, is that handling correlated variables is more than just a matter of looking at VIFs and dropping them if they meet some arbitrary threshold (and the numbers in the OP are far below any threshold that would be used in real life, in any case). – Hong Ooi Jul 24 '13 at 19:51
4

That is a possible and common error. The regression gives coefficients while controlling for the other variables. Simple correlation coefficients do not control for the other variables and,therefore, can give false relationships.

See the chart below from a previous thread for a visual. Variables are negative correlated, but unless they are controlled for, would be be considered positive.

enter image description here

Positive correlation and negative regressor coefficient sign

AOGSTA
  • 321
  • 1
  • 6
  • Here's another answer to a very similar question http://stats.stackexchange.com/a/62061/4485 – Affine Jul 24 '13 at 19:04