3

Why does the density on the y axis sometimes have values greater than 1 if the curve is representing density?

See the example below where I use R's density() function to plot a density curve.

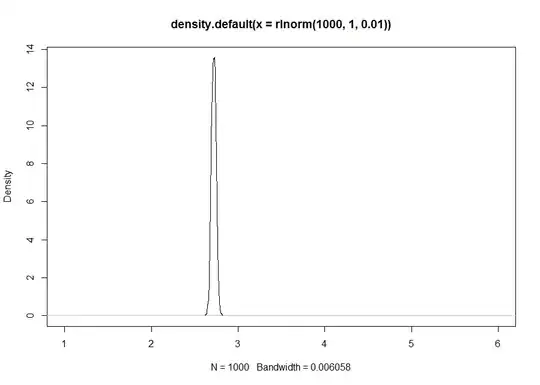
plot(density(rnorm(1000, 1, 0.01)))

Density curve

Glen_b
  • 257,508
  • 32
  • 553
  • 939
user22062
  • 1,319
  • 3
  • 15
  • 21
  • 1
    Include reproducible examples (dput is your friend). – russellpierce Jul 21 '13 at 18:48
  • Hmmm... `density` always plots density, as far as I know, not frequency... can you show an example of it plotting frequency? – nico Jul 21 '13 at 18:49
  • I have attached my example. I mean density not hist. Thanks – user22062 Jul 21 '13 at 19:22
  • @user22062: I think nobody has a problem with `density` plotting density... but in what case do you get frequency? On a side note, your example is not reproducible, as mydataset is not shown... – nico Jul 21 '13 at 21:33
  • 5
    This should *NOT* have been closed as off topic - the underlying issue is clearly a statistical misunderstanding, but the OP is perhaps too confused to realize that. Instead this should be closed as a *duplicate*. – Glen_b Jul 21 '13 at 23:59
  • 2
    It also is a statistical issue that stackoverflow screws up over (http://stackoverflow.com/questions/17368223/ggplot2-multi-group-histogram-with-in-group-proportions-rather-than-frequency) and over (http://stackoverflow.com/questions/10064080/plot-relative-frequencies-with-dodged-bar-plots-in-ggplot2). – russellpierce Jul 22 '13 at 00:24
  • user22062 - to see that this problem has *nothing* to do with R, and is in fact proper behavior of a density function, compute the height of a uniform density on $(0,\frac{1}{2})$ in that range; for more detail, check out @whuber's answer at the link I gave above to the question this is a duplicate of. – Glen_b Jul 22 '13 at 00:30
  • 1
    Corrected, @Glen_b! Thanks for the pointer. (I initially closed a different version of this post.) – chl Jul 22 '13 at 10:26

0 Answers0