4

I would like to model the performance of a rainwater tank, which has a stochastic input (rainfall). The data are the empty volume in the tank at the end of each day. The values are skewed towards the extremes, and I am not sure how to model this or present it statistically. Reviewing various distributions in Wikipedia, I found that it seems like a Beta Distribution - but I am not sure whether it is one. I need to find a statistical method of representing the 'empty volume'.

One friend suggested that I use binomial distribution of getting probability of tank being 25% empty, 50% empty or 75% empty and find confidence intervals associated with those values.

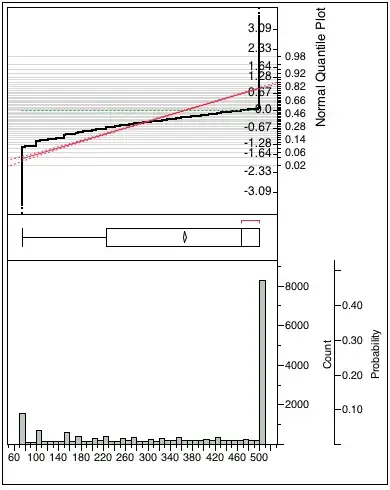
Here is the distribution of my data:

DataDist

EDIT - 11 July 7:28 GMT (following comments for clarification)

The inflow into the tank occurs randomly due to the rainfall. There is regular abstraction from the tank if there is stored volume.

I would like to estimate the probability of the empty volume in the tank on any random day in future based on the the historic data, and associated confidence of that probability.

I would then like to use that 'empty volume' figure to estimate how much of a large storm rainfall it can a large number of such tanks hold back and reduce the flash flooding volumes. Possibly may need to present combined probabilities with the storm probability.

surgez
  • 41
  • 2
  • 2
    What are you actually trying to accomplish. You say you are trying to model it but do you have a model in mind? I.e., are you trying to predict the amount of rainfall for each day? Or make inference about the mean amount of rainfall or....? –  Jul 10 '13 at 21:01
  • 1
    Also, based on your graphs I am not convinced this strategy would work but you could always try a transformation of the data and see if that helps alleviate the normality assumption you seem to be hoping for. –  Jul 10 '13 at 21:20
  • It's *certainly* not binomial, that's for count data. You *might* make an argument for a beta as an approximation, but I doubt that it's actually beta. – Glen_b Jul 11 '13 at 02:08
  • I meant to mention in my previous comment - the observations are going to have serial dependence, which should also not be ignored. – Glen_b Jul 11 '13 at 05:15
  • 1
    It seems to be that a time series approach would be most useful. Something like a stochastic process with a trend, a normal distributed rain input and structural breaks for the extraction. I do not think you should model this as some sort of distribution. The book for all this is Hamilton (1994). Serial dependence, trends etc. are all issues here. I would not recommend picking a model which starts with the assumption of random picking as some said below, as this is clearly not the case. One input maybe iid, the actual barrel state is not. – IMA Jul 11 '13 at 08:29
  • I am interested in getting the probability and confidence associated with the available tank volumes, which I will use in a different program (hydrological modelling) where I will be using a 'design rainfall for storm events' and use the volume of storage provided by a number of such tanks as detention of the rainfall runoff. Empirical distribution might be a way (as suggested by @willy), and I will look at semi parametric model as suggested by @FrankHarrel (but I guess it will require a lot of reading) – surgez Jul 11 '13 at 09:56
  • @Glen_b Just read another posting (http://stats.stackexchange.com/questions/39323/how-to-analyse-a-continuous-response-having-a-bimodal-distribution) on bimodal distribution. That might possibly work? – surgez Jul 11 '13 at 17:10
  • If you're asking 'could beta regression work?' then possibly, but the central problem (as with any regression model) is still serial dependence; you might be better modelling the physical circumstances of the process itself and trying to estimate parameters there. @IMA's comment has some useful points in it. – Glen_b Jul 12 '13 at 00:59

4 Answers4

6

I would recommend a semiparametric model such as the proportional odds model. This nicely handles data clumping. The model will have one intercept per unique $Y$ value, less one. In two days there will be a major update to the R rms package containing a new ordinal regression modeling function orm that uses sparse matrix algebra to efficiently handle continuous $Y$ (thousands of intercepts). Chapter 15 of my latest course notes contains a case study - see http://biostat.mc.vanderbilt.ede/rms and click on Course Notes. orm handles 4 other distribution families besides the logistic.

Frank Harrell
  • 74,029
  • 5
  • 148
  • 322
2

@COOLSerdash's comment is right on target (+1). It seems unlikely that your data are actually any of the named distributions, such as beta, and the answer by @Glen_b will provide a nice example of how you might go about exploring your dataset.

The fitdistrplus package in R will provide you with some tools that may be helpful. For example, if you just want to estimate the parameters of the beta distribution that maximize the likelihood of your data, ?fitdist will help.

gung - Reinstate Monica
  • 132,789
  • 81
  • 357
  • 650
2

"The data are the empty volume in the tank at the end of each day."

  • The data are time indexed, you have to take this feature into consideration.

  • It is likely that the data are dependent. Someone/Something fill up the tank at some time points or when the tank is close to depletion.

I suggest to take a look at Time Series models (e.g. autoregressive models), rather than fitting a distribution to the raw observations, in order to avoid throwing all the features of the data.

The estimation procedures recommended in the other answers do not consider possible dependencies of the data and time indexing.

Kronos
  • 21
  • 2
  • 1
    Something: the tank is open vertically and there are inputs of rainfall. – Nick Cox Jul 11 '13 at 00:34
  • 1
    @NickCox Thanks for the clarification. I guess a different something extracts water from the tank. – Kronos Jul 11 '13 at 00:35
  • Yes, the input is rain from a catchment surface, and abstraction is for use - e.g. gardening, irrigation or other uses. – surgez Jul 11 '13 at 09:12
0

I assume you are trying to find some well known distribution to model your data. If this is the case, then you could do a goodness of fit test. This is a well known test and there are several methods. You will be testing many different distributions to see which one best fits. Then just pick the one that best works for you.

Not sure what you are doing this for, but you could use an empirical distribution, which is basically just the sample itself.

These methods are easy to look up online.

willy
  • 16
  • 2
    I'd be surprised if the data would follow any well-known distribution at all. @surgez [This post](http://stats.stackexchange.com/questions/58220/what-distribution-does-my-data-follow) might be of interest too. – COOLSerdash Jul 10 '13 at 21:46