9

THis is a data visualization question. I have a database that contains some data that is constantly revised (online update). What is the best way in R to update a graph every let say 5 or 10 seconds. (without plotting again the all thing is possible)?

fRed

RockScience
  • 2,731
  • 4
  • 27
  • 46

2 Answers2

8

For offline visualization, you can generate PNG files and convert them to an animated GIF using ImageMagick. I used it for demonstration (this redraw all data, though):

source(url("http://aliquote.org/pub/spin_plot.R"))
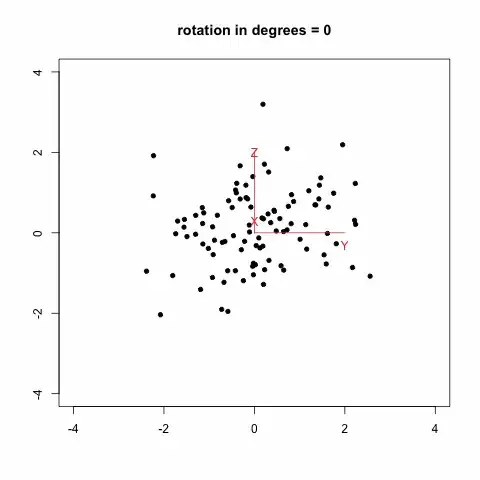
dd <- replicate(3, rnorm(100))
spin.plot(dd)

This generates several PNG files, prefixed with fig. Then, on an un*x shell,

convert -delay 20 -loop 0 fig*.png sequence.gif

gives this animation (which is inspired from Modern Applied Biostatistical Methods using S-Plus, S. Selvin, 1998):

alt text

Another option which looks much more promising is to rely on the animation package. There is an example with a Moving Window Auto-Regression that should let you go started with.

chl
  • 50,972
  • 18
  • 205
  • 364
7

Assuming you want to update R windows() or x11() graph, you can use functions like points() and lines() to add new points or extend lines on a graph without redraw; yet note that this won't change the axes range to accommodate points that may go out of view. In general it is usually a good idea to make the plotting itself instantaneous -- for instance by moving computation effort into making some reduced middle representation which can be plotted rapidly, like density map instead of huge number of points or reducing resolution of line plots (this may be complex though).

For holding R session for a certain time without busy wait, use Sys.sleep().

  • (+1) I forgot the `Sys.sleep()` function. I think the $x$- and $y$-axis range should bet set up in advance, no? – chl Jan 06 '11 at 12:26
  • @chl, yes the $x$ and $y$ axis ranges should be set up in advance. – mpiktas Jan 06 '11 at 13:30
  • 1
    @mpiktas Or just init the plot with a single call to `plot()`, possibly with `0,0,type="n"` if there is nothing to plot yet... Indeed this is much easier than ding `plot.new()` and adding all the stuff like axes or labels by hand. –  Jan 06 '11 at 13:49
  • Indeed this seems the simplest... but too bad that the axes are not updated. As I want to update online a time series, and I know at which speed the x axis moves, I guess that I can replot everything every n updates. – RockScience Jan 07 '11 at 03:06