I am working on the data set electricity available in R package TSA. My aim is to find out if an arima model will be appropriate for this data and eventually fit it. So I proceeded as follows:
1st: Plot the time series which resulted if the following graph: 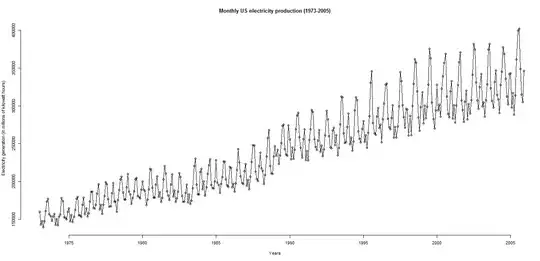
2nd: I wanted to take log of electricity to stabilize variance and afterward differenced the series as appropriate, but just before doing so, I tested for stationarity on the original data set using the adf (Augmented Dickey Fuller) test and surprisingly, it resulted as follows:
Code and Results:
adf.test(electricity)

             Augmented Dickey-Fuller Test
data:  electricity
Dickey-Fuller = -9.6336, Lag order = 7, p-value = 0.01
alternative hypothesis: stationary
Warning message: In adf.test(electricity) : p-value smaller than printed p-value
Well, as per my beginner's notion of time series, I suppose it means that the data is stationary (small p-value, reject null hypothesis of non-stationarity). But looking at the ts plot, I find no way that this can be stationary. Does anyone has a valid explanation for this?