4

The following is a spatial point pattern: enter image description here

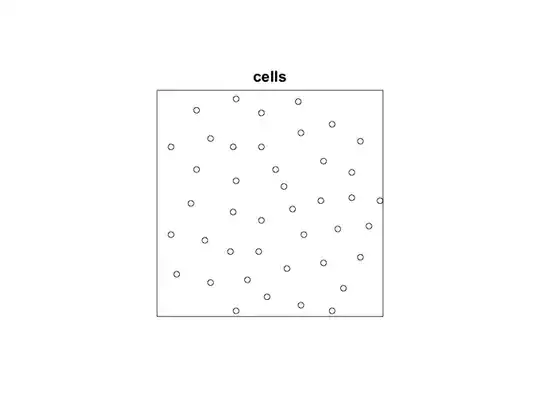
and these are the corresponding Ripley's K function and L function for this data: enter image description here

enter image description here

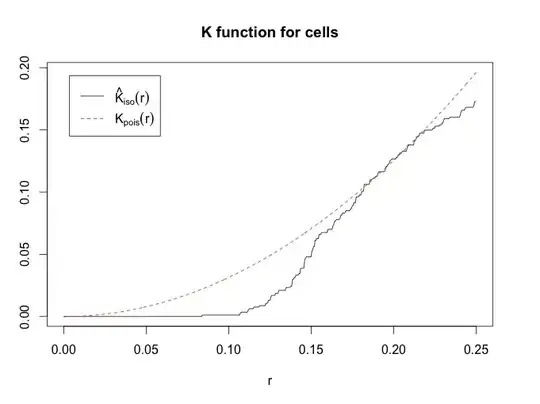
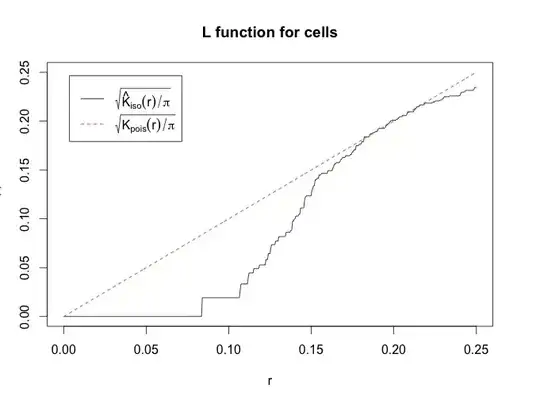
How are these functions interpreted?

Gabriel
  • 3,072
  • 1
  • 22
  • 49
hearse
  • 2,355
  • 1
  • 17
  • 30

1 Answers1

5

If L(observed) < L(expected), the pattern is more regular than expected, if L(observed) > L(expected) the pattern is clustered

Corey Sparks
  • 824
  • 6
  • 8
  • 2
    So would this say that at distances of 0.15 or greater, the cells are randomly and evenly dispersed, but at closer distances the cells are organized in a way that avoids clustering -- perhaps implies a kind of repulsion? – Wayne Apr 27 '13 at 01:34
  • 2
    I would use the simulation (envelope()) function before I put any statements on that, you need to evaluate how many times you could observe similar values of L by chance – Corey Sparks Apr 28 '13 at 00:23
  • A nice(r) graph is to plot r-L vs r (or L-r vs r) so deviations from the expected value under CSR (now=0) are shown as positive or negative. Also, envelopes will be symmetrical(ish) around zero – FairMiles Sep 02 '15 at 15:53