3

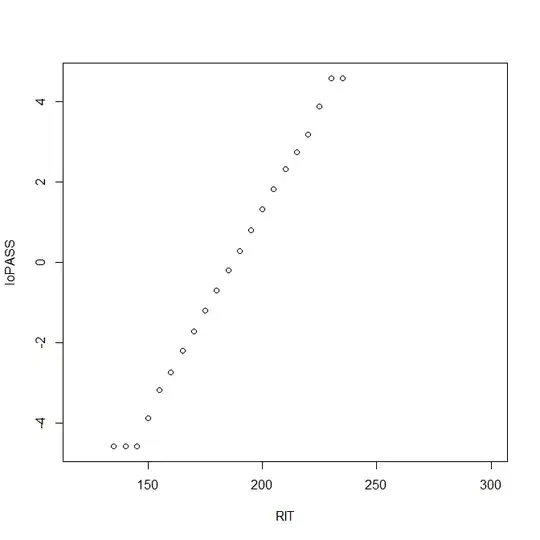
I'm reading the technical manual for a linking study between two assessments. It's pretty clear that the table is model output from a fitted logistic regression equation. Here's what pass odds look like on test 2 as a function of score on test 1 (RIT score):

enter image description here

It seems silly to use a lookup table that rounds to 5 when the model that made that table could give a better estimate. But how do I recreate that equation from this output?

I have a good sense of how I would fit this model if I had the raw data, but I'm not sure what to do here. Not glm(family=binomial) because the data I have is are odds ratios, not pass / no pass (i.e., 1s and 0s), right?

Here's the data:

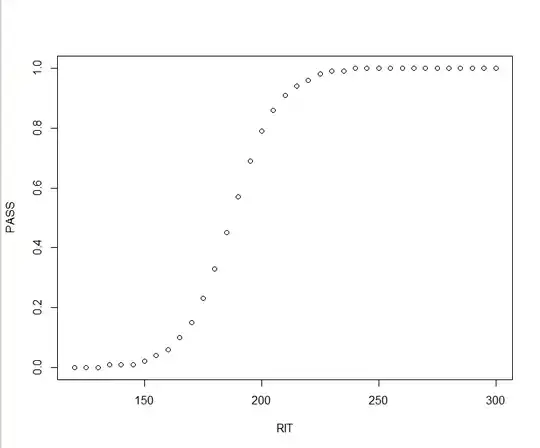
PASS <- c(0, 0, 0, 0.01, 0.01, 0.01, 0.02, 0.04, 0.06, 0.1, 0.15, 0.23, 
0.33, 0.45, 0.57, 0.69, 0.79, 0.86, 0.91, 0.94, 0.96, 0.98, 0.99, 
0.99, 1, 1, 1, 1, 1, 1, 1, 1, 1, 1, 1, 1, 1)

RIT <- c(120L, 125L, 130L, 135L, 140L, 145L, 150L, 155L, 160L, 165L, 
170L, 175L, 180L, 185L, 190L, 195L, 200L, 205L, 210L, 215L, 220L, 
225L, 230L, 235L, 240L, 245L, 250L, 255L, 260L, 265L, 270L, 275L, 
280L, 285L, 290L, 295L, 300L)
gung - Reinstate Monica
  • 132,789
  • 81
  • 357
  • 650
user24547
  • 31
  • 1

1 Answers1

2

Logistic regression is linear when the parameter, $\pi$, that controls the behavior of the Bernoulli response is transformed into a log odds:
$$ \ln\left(\frac{\pi_i}{1-\pi_i}\right) = \beta_0 + \beta_1x_i $$ Your variable PASS is a vector of predicted probabilities. These can be converted into log odds using the LHS of the equation above. Once there, these should form a straight line as a function of RIT. Here is some R code to do this:

oPASS = PASS / (1-PASS)
loPASS = log(oPASS)

A plot of these values shows that there was some rounding in the predicted probabilities that you were given:

enter image description here

You can also see the issue if you look at the loPASS variable:

> loPASS
 [1]       -Inf       -Inf       -Inf -4.5951199 -4.5951199 -4.5951199
 [7] -3.8918203 -3.1780538 -2.7515353 -2.1972246 -1.7346011 -1.2083112
[13] -0.7081851 -0.2006707  0.2818512  0.8001193  1.3249254  1.8152900
[19]  2.3136349  2.7515353  3.1780538  3.8918203  4.5951199  4.5951199
[25]        Inf        Inf        Inf        Inf        Inf        Inf
[31]        Inf        Inf        Inf        Inf        Inf        Inf
[37]        Inf

Thus, we will work with the 7th & 23rd data points to get a reasonably accurate result.

Once we have these values, we can calculate the slope using the point-slope formula, and the intercept, by algebraically rearranging the equation of the line:

b1 = (loPASS[23]-loPASS[7]) / (RIT[23]-RIT[7])
b0 = loPASS[7] - b1*RIT[7]

That yields the parameter estimates that had been used to generate the predicted probabilities that you were given:

> b0
[1] -19.80483
> b1
[1] 0.1060868

For more information about logistic regression, it may help you to read my answer here: difference-between-logit-and-probit-models.

gung - Reinstate Monica
  • 132,789
  • 81
  • 357
  • 650