When reading up on biplots in a principal component context, I found that in SAS setting c = 0 gives you a GH biplot that represents the vectors correctly.[1] The same applies in STATA.[2]
From what I understand, this means that in a GH biplot, the cosine of the angle between two vectors approximate the correlation between those variables. However, when I use the biplot() function in R, the scale argument seems to be defined in the opposite way, with scale = 1 leading to a GH biplot, and not scale = 0.
Am I missing something, or is it the case that the biplot() function uses the opposite notation than SAS and STATA does? And in that case, why?
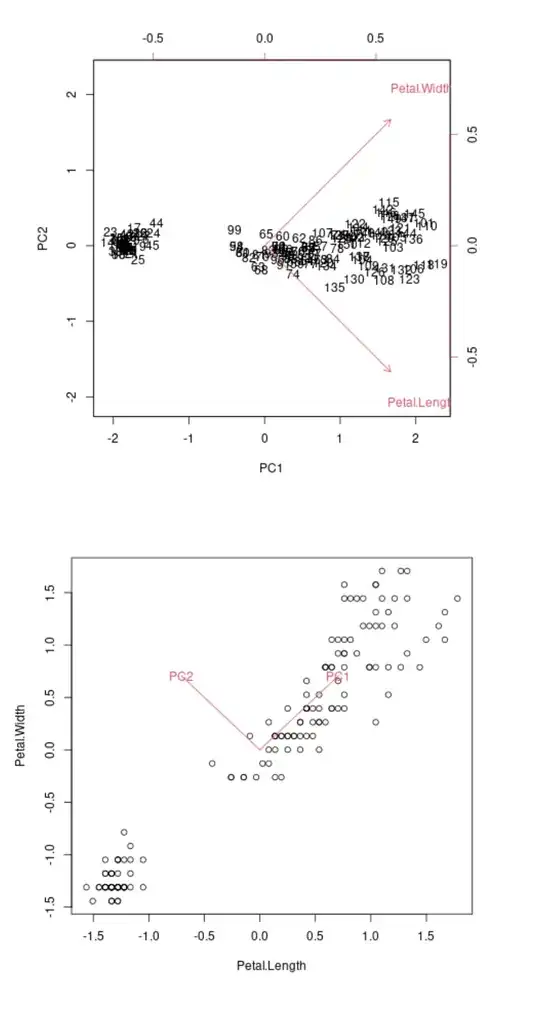
Because look at the following two PC biplots made in R on a subset of the iris data set (namely, iris[, 3:4]). Due to only two variables being used, the cosine of the angle between the two vectors should be exactly the correlation between the GH biplot. Note that in the case with scale = 0 the angle is 90 degrees and thus the cosine of the angle is 0, which clearly isn't correct.