0

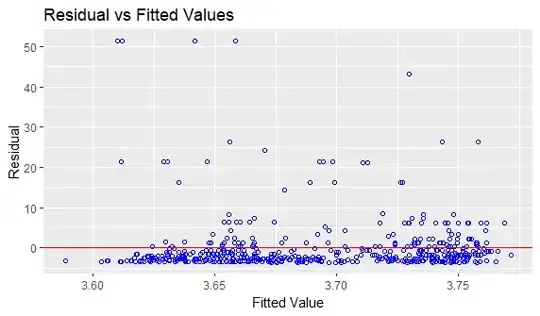
So I am pretty confused. I want to create a GLM and I dont know what distribution my residuals have in order to fit the regression model. I created a Cullen-Frey-Graph that says I have a beta distribution. When I analyse the residuals of the model however, it looks like I have a positive skewness hinting to a Gamma distribution. My response variable is percentage weed coverage and it contains a lot of very small numbers. So which is it?

Edit: I also a scatterplot to show the Y ~ X relation
enter image description here

enter image description here

enter image description here

enter image description here

enter image description here

Effigy
  • 51
  • 5
  • 1
    Beta is also positively skewed in your case, and is furthermore bounded between 0 and I, unlike gamma. – BigBendRegion Jan 28 '22 at 17:00
  • 1
    Consider that the distribution of the residuals will change depending which family you use, because they will fit different mean models. GLMs do not employ "residual" term. You need to think about the condition Y|X. The unconditional Y do not tell you anything meaningful. The most useful graph to show us is a simple scatterplot of Y against X. – AdamO Jan 28 '22 at 17:05
  • @Adam according to the second answer I should be using a Gamma model or do a gamma regression or however you call it, because I have a continous, non-negative outcome.. does that sound plausibel? Why does the Cullen Frey Graph then tell me its Beta?? Regression modeing is so a huge mindf*** and just confusing!! – Effigy Jan 28 '22 at 17:18
  • GLMs are not for the faint of heart, and it's definitely not amateur-level. I suggest you ditch whatever guide your following, you can do exploratory statistics all day long and never get an answer. The choice of GLM should be *prespecified* - i.e. decided without looking at the data - and chosen because of the estimation. *Most* of the time, people are just interested in a test of mean differences, and so linear regression solves that problem. If the residuals are skewed or heteroscedastic, just fit a sandwich standard error. – AdamO Jan 28 '22 at 17:34
  • I agree broadly with @AdamO and add emphasis on a few points. The marginal distribution of the outcome has limited relevance to choosing a model. The graph is not telling you that your distribution is beta, but more that the skewness and kurtosis are consistent with beta. In mentioning just a few named distributions the graph keeps some simplicity, but there are many more distributions -- and most importantly of all distributions are not like birds or mammals -- which must be one species or another -- but they can easily be mixtures or just fail to follow any particular shape that has a name. – Nick Cox Jan 28 '22 at 17:44
  • You're fitting a model but telling us precisely nothing about the predictors or about exactly what model it was that yields these residuals. – Nick Cox Jan 28 '22 at 17:46
  • The marginal Y distribution is actually quite relevant. For example, if it is a distribution on 0 and 1, then you know that you should use logistic regression, understanding of course that the conditionals will different Bernoulli's, depending on X. If the marginal distribution of Y is multinomial, that information is similarly prescriptive. And if the marginal distribution is bounded between 0 and 1, then so are the conditionals, which indicates a problem with unbounded distributions like gamma. – BigBendRegion Jan 28 '22 at 18:15
  • @BigBendRegion Indeed, the support of the outcome can be crucial in indicating appropriate models, but scarcely the precise skewness and kurtosis of the outcome. – Nick Cox Jan 28 '22 at 18:29
  • Hmmm... In many cases, eg regression models that predict market inefficiency, there is little relationship between X and Y. In such cases the marginal moments of Y are similar to the conditional moments. I agree, though, that regression is a model for conditional distributions, and that marginals and conditionals should not be confused. – BigBendRegion Jan 29 '22 at 01:19
  • Hey, thanks for all the comments. I did not understand a lot, but I think I will look into AdamO's suggestion of ditching GLMs and rather going to fit a sandwhich standard error -after I learn what that actually means. I do wanna test for mean difference. Just for clarification: I want to model the relationship between weed coverage (continuous response variable in % ) and soil moisture (continuous predictor variable in %) for different dates (categorical predictor variable). I also added a scatterplot of Y ~ X as suggested by BigBendRegion. Thanks for your help – Effigy Jan 30 '22 at 15:22

0 Answers0