1

I am trying to write a function in R that automatically chooses the optimal parameters epsilon and MinPts in a DBSCAN analysis. I found that the k-nearest neighbour plot was very useful in order to select the optimal eps. However, I am trying to make the whole process automatic, and I was wondering if there was any method to locate the exact position of the knee so as to have the most representative eps possible.

I tried listing all the slope variations at each point of a kNN dist plot and take the maximum value (since the knee represents the maximum point of curvature), but It wasn't very useful. Is it, indeed, possible to find the knee automatically or should one just rely on an approximative graphical value of Epsilon?

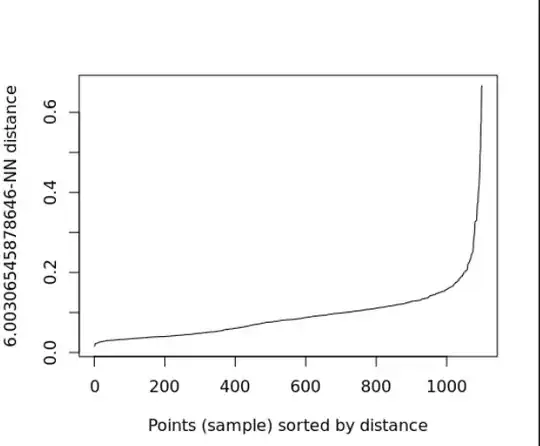
Here is a typical graph that you could get:

We see that the knee should be a bit less than 0.2

Thanks in advance.

Swann
  • 11
  • 2
  • Can you please edit your question to include an example plot? – Adrian Keister Dec 28 '21 at 22:27
  • 1
    Large slopes have almost nothing to do with large curvature. Is your problem, then, one of computing the curvature of a graph? – whuber Dec 28 '21 at 23:25
  • Yes, I think I was looking at the problem in a wrong way. Looking at the curvature might help me indeed! I am quite confused – Swann Dec 29 '21 at 11:10
  • 2
    Frame challenge: I don't think clustering, in general, or DBSCAN, in particular, is best done 'automatically' / without the analyst thinking hard about their situation at each step. – gung - Reinstate Monica Dec 29 '21 at 13:32
  • @gung Very good point. I nevertheless remain sympathetic with the aims of automatic methods to the extent they might be needed for reviewing huge numbers of datasets, or at least streamline the analyst's effort by suggesting a reasonable range of decisions to make. – whuber Dec 29 '21 at 20:14
  • 1
    Does https://stats.stackexchange.com/q/88872/40036 help? For instance the answer suggesting the kneed package in python seems to be along the lines of what you are asking for. – josliber Dec 29 '21 at 20:14
  • It's perfect thank you – Swann Dec 30 '21 at 15:01

1 Answers1

1

As others have suggested, while automated methods will almost always provide some value as the optimal number of clusters, k, review by a human with subject matter expertise is necessary to ensure that the result is meaningful. For example, when the data have poor separation into discrete clusters, these algorithms will still provide a value, but it often takes a human to look at the diagnostic plots to determine if that value of k has significant merit over other nearby solutions and whether any prior knowledge about the dataset can inform intuition on an appropriate value or at least boundaries around where to find k.

Furthermore, there are many valid approaches to quantifying cluster separation/cohesion and they don't always agree. Selecting the correct distance metric and method of quantifying the 'optimal' value of k is nuanced and requires careful thinking about the specific data and problem you're working on.

All that said - one approach is to use many algorithms and see if they provide a concensus answer to the 'optimal' value of k. Below is an example of how to do this in R with the classic iris dataset. Here I'm using the {NbClust} package which automatically runs 30 different methods and provides a summary for the number of clusters proposed by each (along with some diagnostic plots which I've clipped for brevity). This can be a useful starting place.

library(NbClust)

iris_k <- NbClust(data = iris[, 1:4],
                  distance = "euclidean",
                  method = "complete")
     
    #> ******************************************************************* 
    #> * Among all indices:                                                
    #> * 2 proposed 2 as the best number of clusters 
    #> * 13 proposed 3 as the best number of clusters 
    #> * 5 proposed 4 as the best number of clusters 
    #> * 1 proposed 6 as the best number of clusters 
    #> * 2 proposed 15 as the best number of clusters 
    #> 
    #>                    ***** Conclusion *****                            
    #>  
    #> * According to the majority rule, the best number of clusters is  3 
    #>  
    #>  
    #> *******************************************************************

Created on 2021-12-30 by the reprex package (v2.0.1)
Dan Adams
  • 111
  • 3