13

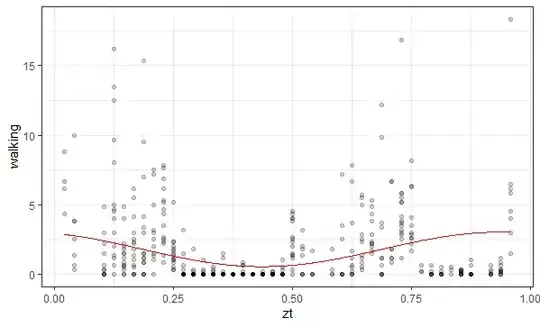
I'm trying to fit a sine wave over some activity data, just like this post. I've managed to get a reasonable looking graph for one condition:

img

However, when I plot the other condition the wave looks incredibly weird and not what it should look like --- it should be nice and smooth like the first image. Also, it should have two peaks and one trough like the first image.

img2

What's going wrong here? Is there anything I can do to fix this? The second condition has the same 48 hours, etc.

My data has hourly measurements across a 48 hour period (two consecutive days, so there should be one peak and one trough/day). Code was adapted from here.

b$zt <- b$zt/48
lmfit <- lm(data = b,
            walking ~ sin(2*pi*b$zt) + cos(2*pi*b$zt))
b0 <- coef(lmfit)[1]
alpha <- coef(lmfit)[2]
beta <- coef(lmfit)[3]

pframe <- data.frame(zt=seq(min(b$zt),max(b$zt),length=612))
pframe$walking <- predict(lmfit,newdata=pframe)
library(ggplot2); theme_set(theme_bw())
ggplot(b,aes(zt,walking))+
  geom_point(alpha=0.2) + geom_line(data=pframe,colour="red")

Here are the relevant parts from the dataset:

 dput(new$zt)
c(6L, 6L, 6L, 6L, 7L, 7L, 7L, 7L, 8L, 8L, 8L, 8L, 9L, 9L, 9L, 
9L, 11L, 11L, 11L, 11L, 12L, 12L, 12L, 12L, 15L, 15L, 15L, 15L, 
17L, 17L, 17L, 17L, 23L, 23L, 23L, 23L, 24L, 24L, 24L, 24L, 1L, 
1L, 1L, 1L, 5L, 5L, 5L, 5L, 6L, 6L, 6L, 6L, 7L, 7L, 7L, 7L, 8L, 
8L, 8L, 8L, 9L, 9L, 9L, 9L, 10L, 10L, 10L, 10L, 11L, 11L, 11L, 
11L, 12L, 12L, 12L, 12L, 13L, 13L, 13L, 13L, 14L, 14L, 14L, 14L, 
15L, 15L, 15L, 15L, 17L, 17L, 17L, 17L, 19L, 19L, 19L, 19L, 24L, 
24L, 24L, 24L, 5L, 5L, 5L, 5L, 6L, 6L, 6L, 6L, 7L, 7L, 7L, 7L, 
8L, 8L, 8L, 8L, 9L, 9L, 9L, 9L, 10L, 10L, 10L, 10L, 11L, 11L, 
11L, 11L, 12L, 12L, 12L, 12L, 22L, 22L, 22L, 22L, 24L, 24L, 24L, 
24L, 2L, 2L, 2L, 2L, 5L, 5L, 5L, 6L, 6L, 6L, 7L, 7L, 7L, 8L, 
8L, 8L, 9L, 9L, 9L, 10L, 10L, 10L, 11L, 11L, 11L, 12L, 12L, 12L, 
14L, 14L, 14L, 15L, 15L, 15L, 16L, 16L, 16L, 17L, 17L, 17L, 18L, 
18L, 18L, 19L, 19L, 19L, 21L, 21L, 21L, 22L, 22L, 22L, 23L, 23L, 
23L, 24L, 24L, 24L, 2L, 2L, 2L, 31L, 31L, 31L, 31L, 32L, 32L, 
32L, 32L, 33L, 33L, 33L, 33L, 35L, 35L, 35L, 35L, 36L, 36L, 36L, 
36L, 39L, 39L, 39L, 39L, 41L, 41L, 41L, 41L, 42L, 42L, 42L, 42L, 
44L, 44L, 44L, 44L, 45L, 45L, 45L, 45L, 46L, 46L, 46L, 46L, 25L, 
25L, 25L, 25L, 26L, 26L, 26L, 26L, 28L, 28L, 28L, 28L, 30L, 30L, 
30L, 30L, 35L, 35L, 35L, 35L, 29L, 29L, 29L, 29L, 30L, 30L, 30L, 
30L, 31L, 31L, 31L, 31L, 32L, 32L, 32L, 32L, 33L, 33L, 33L, 33L, 
34L, 34L, 34L, 34L, 35L, 35L, 35L, 35L, 36L, 36L, 36L, 36L, 38L, 
38L, 38L, 38L, 41L, 41L, 41L, 41L, 42L, 42L, 42L, 42L, 45L, 45L, 
45L, 45L, 46L, 46L, 46L, 46L, 29L, 29L, 29L, 30L, 30L, 30L, 31L, 
31L, 31L, 32L, 32L, 32L, 33L, 33L, 33L, 34L, 34L, 34L, 35L, 35L, 
35L, 36L, 36L, 36L, 37L, 37L, 37L, 38L, 38L, 38L, 39L, 39L, 39L, 
40L, 40L, 40L, 41L, 41L, 41L, 42L, 42L, 42L, 44L, 44L, 44L, 45L, 
45L, 45L, 25L, 25L, 25L, 13L, 13L, 13L, 13L, 14L, 14L, 14L, 14L, 
16L, 16L, 16L, 16L, 18L, 18L, 18L, 18L, 19L, 19L, 19L, 19L, 20L, 
20L, 20L, 20L, 21L, 21L, 21L, 21L, 22L, 22L, 22L, 22L, 13L, 13L, 
13L, 13L, 14L, 14L, 14L, 14L, 15L, 15L, 15L, 15L, 17L, 17L, 17L, 
17L, 18L, 18L, 18L, 18L, 21L, 21L, 21L, 21L, 16L, 16L, 16L, 16L, 
18L, 18L, 18L, 18L, 20L, 20L, 20L, 20L, 21L, 21L, 21L, 21L, 22L, 
22L, 22L, 22L, 23L, 23L, 23L, 23L, 13L, 13L, 13L, 13L, 14L, 14L, 
14L, 14L, 15L, 15L, 15L, 15L, 16L, 16L, 16L, 16L, 17L, 17L, 17L, 
17L, 18L, 18L, 18L, 18L, 19L, 19L, 19L, 19L, 20L, 20L, 20L, 20L, 
21L, 21L, 21L, 21L, 14L, 14L, 14L, 14L, 16L, 16L, 16L, 16L, 17L, 
17L, 17L, 17L, 18L, 18L, 18L, 18L, 21L, 21L, 21L, 21L, 22L, 22L, 
22L, 22L, 13L, 13L, 13L, 20L, 20L, 20L, 13L, 13L, 13L, 14L, 14L, 
14L, 17L, 17L, 17L, 21L, 21L, 21L)

> dput(new$walking)
c(8, 1.166666667, 4.666666667, 2, 4.833333333, 2, 1.833333333, 
4, 2.5, 1.333333333, 4.166666667, 1.833333333, 7, 1.166666667, 
9.5, 1.166666667, 6.833333333, 5.166666667, 4.333333333, 2.333333333, 
5.166666667, 2.333333333, 2, 1.833333333, 0, 0, 0, 0, 0, 0, 1.5, 
0, 0, 0, 1, 0.333333333, 0.333333333, 1.5, 2.5, 2.333333333, 
4.333333333, 8.833333333, 6.666666667, 6.166666667, 2.166666667, 
0.333333333, 0, 0, 9.666666667, 12.5, 13.5, 16.16666667, 0, 2.166666667, 
0.666666667, 0.5, 0, 2.333333333, 0, 0, 0, 1.5, 3, 0.833333333, 
3, 7.5, 5, 3.166666667, 7.666666667, 7.833333333, 2.666666667, 
2.5, 2.333333333, 1, 1.666666667, 0.333333333, 1.5, 0.666666667, 
0.333333333, 3.166666667, 1.833333333, 0, 0, 0, 0, 1, 0, 0, 0, 
1.166666667, 0, 0, 0, 0.833333333, 0.666666667, 0.666666667, 
0, 4, 4.5, 3.833333333, 0, 3, 0.333333333, 0, 4.5, 1.333333333, 
5, 3, 0, 0.666666667, 0.333333333, 1.5, 3, 5.5, 1, 6.166666667, 
1.5, 3.333333333, 15.33333333, 4.166666667, 2, 1.333333333, 7.166666667, 
1.5, 1.333333333, 5.333333333, 4.666666667, 6.166666667, 0.333333333, 
1.166666667, 0.833333333, 1.5, 0, 0, 0, 0.166666667, 1.166666667, 
2, 1.333333333, 4.333333333, 3.833333333, 1.333333333, 0.333333333, 
0.666666667, 1.5, 4.833333333, 0.666666667, 0.666666667, 0, 4, 
1.5, 0.833333333, 1.166666667, 2.166666667, 0.5, 0.666666667, 
0, 0, 0.833333333, 2.5, 1, 0, 0.833333333, 3.5, 2.166666667, 
1, 1.333333333, 0.5, 0.333333333, 0.166666667, 0, 0, 0.166666667, 
0.333333333, 0.333333333, 0.166666667, 0.5, 0, 0.166666667, 0, 
0, 0, 0, 0, 0.166666667, 0, 0, 0, 0.166666667, 0, 0.166666667, 
0, 0, 0, 0.5, 1.333333333, 4, 2.666666667, 3.833333333, 2.5, 
10, 1.166666667, 5, 2.5, 2.333333333, 3.833333333, 4.833333333, 
2, 2.833333333, 0, 0.666666667, 0, 0, 3, 3.5, 5.166666667, 3.166666667, 
3.5, 2.833333333, 2.166666667, 8.166666667, 0.166666667, 0.5, 
0, 0, 0.333333333, 0.166666667, 0.333333333, 0, 0, 0.666666667, 
0, 0, 0.166666667, 0.333333333, 0.666666667, 0, 0.166666667, 
0.166666667, 1.166666667, 0.666666667, 3, 6.5, 4, 6.166666667, 
0, 3.166666667, 1.333333333, 2, 0, 0, 1.666666667, 0, 1.833333333, 
0, 0.333333333, 0, 0, 0.166666667, 0.5, 0, 3.666666667, 1.166666667, 
3.833333333, 2.5, 0, 0, 0, 0, 1.666666667, 1.166666667, 0.666666667, 
0, 0.833333333, 2.833333333, 1.333333333, 0.5, 2.166666667, 1.5, 
1.666666667, 4.333333333, 12.16666667, 9.833333333, 3.666666667, 
3.333333333, 1.166666667, 6.666666667, 1.833333333, 1.166666667, 
5.5, 4.166666667, 5.833333333, 16.83333333, 2.602230483, 6.319702602, 
1.672862454, 4.089219331, 0, 0.666666667, 0, 0, 0.166666667, 
0.166666667, 0, 0, 0, 0, 0, 1, 0, 0.166666667, 0.333333333, 0.833333333, 
18.33333333, 5.833333333, 1.5, 4.5, 3.5, 7.166666667, 2.5, 7.833333333, 
3.666666667, 6.666666667, 0.333333333, 5.666666667, 5.5, 2.166666667, 
5.333333333, 2.333333333, 1.166666667, 1.166666667, 0, 0.833333333, 
6.666666667, 1.833333333, 2.833333333, 5.833333333, 5.166666667, 
2.941176471, 2.573529412, 6.25, 0.166666667, 0.666666667, 0.166666667, 
0, 0, 0.166666667, 0, 0, 0, 0.5, 0, 0.333333333, 0, 0, 0.333333333, 
0, 0, 0, 0, 0, 0, 0, 0.333333333, 0, 0, 0, 1.833333333, 0, 0, 
0, 0, 0, 0, 0, 0, 0, 0, 0, 0, 0, 0, 0, 0, 0, 0, 0, 0, 0, 0, 0, 
0, 0, 0, 0, 0, 0, 0, 0, 0, 0, 0, 0, 0, 0, 0, 0, 0, 0, 0, 0, 0, 
0, 0, 0, 0, 0, 0, 0, 0, 0, 0, 0, 0, 0, 0, 0, 0, 0, 0, 0, 0, 0, 
0, 0, 0, 0, 0, 0, 0, 0, 0, 0, 0, 0, 0, 0, 0, 0, 0, 0, 0, 0, 0, 
0, 0, 0, 0, 0, 0, 0, 0, 0, 0, 0, 0, 0, 0, 0, 0, 0, 0, 0, 0, 0, 
0, 0, 0, 0, 0, 0, 0, 0, 0, 0, 0, 0, 0, 0, 0, 0, 0, 0, 0, 0, 0, 
0, 0, 0, 0, 0, 0, 0, 0, 0, 0, 0, 0, 0, 0, 0, 0, 0, 0, 0, 0, 0, 
0, 0, 0, 0, 0, 0, 0, 0, 0)
Ben
  • 91,027
  • 3
  • 150
  • 376
  • You are fitting with a fixed frequency. Do you know this frequency already from some external knowledge about the data generating process? If not, you would first need to apply a frequency estimation method. As you are using R, you can also try a non-parametric approach, like loess, which does a local fit and thus can follow an arbitrary curve. – cdalitz Dec 17 '21 at 15:01
  • 5
    `lm` is inappropriate for these data, which exhibit highly asymmetrical variation. The long gaps with near-zero activity indicate a sine would be a poor model, anyway. You therefore need to rethink what you're doing. Begin with the objective: what are you hoping to get out of this analysis? – whuber Dec 17 '21 at 17:11
  • Thanks for the suggestions! @cdalitz The data was collected every hour (and as it's rhythmic behaviour I know it should repeat) , so this is why I fitted with a fixed frequency, although I may be misunderstanding what frequency is here? – Jessica Harvey-Carroll Dec 17 '21 at 17:37
  • @whuber this is really helpful thank you so much. My objective for this data was to identify the peaks and troughs/ rhythmicity of behaviours for each condition and then compare them. I thought modelling both as a sine wave and looking at displacement would work. What would you suggest instead of a sine model? Thanks! – Jessica Harvey-Carroll Dec 17 '21 at 17:40
  • 6
    It depends on what "walking" is and how it was measured, but among the likeliest candidates for a useful model would be a GLM (perhaps with Poisson responses) along with a [circular spline](https://stats.stackexchange.com/search?q=circular+spline) of the time variable among the explanatory variables. – whuber Dec 17 '21 at 17:53
  • 2
    If this is a time series, ARIMA might be a better model, which decomposes the observations into a periodic part and a trend. – cdalitz Dec 17 '21 at 18:09
  • Can you tell us a little bit more about what the "walking" variable means/how it was measured? – Ben Bolker Dec 18 '21 at 22:03
  • @BenBolker sorry! I have 6 different behaviours, and the time spent performing these behaviours was recorded (in seconds) for 5 mins, every half an hour for 48 consecutive hours. The final numbers (as seen here) are the percentage of time/hour spent performing the behaviour. – Jessica Harvey-Carroll Dec 18 '21 at 22:09
  • In principle, then, you could use a Beta distribution for the response (`?mgcv::betar`), but zero values are a nuisance. Since your percentages are all small, @whuber's approach with `family = "quasipoisson"` is probably are fine (if you had percentages approaching 50% or greater then we might have to think about it ...) – Ben Bolker Dec 18 '21 at 22:16
  • abs(fft(x)) should give you frequency vs magnitude. Clip frequencies with small magnitude and quantize the rest to turn this into a regression with fewer variables. – Navin Dec 31 '21 at 23:48

2 Answers2

14

You are using the wrong frequency $\omega$, or wavelength $\lambda$. The period ("wavelength") of a sine function is defined by $\sin(\omega(t+\lambda)) = \sin(\omega t)$, and thus $$\omega(t+\lambda) = 2\pi \iff \omega=\frac{2\pi}{\lambda}$$ A rough (visual) guess of the wavelength in the data you have posted is 25. Note that this is not the range for b\$zt shown in your first plot! If I fit the model as follows, I obtain a decent result:

lmfit <- lm(walking ~ sin(2*pi/25*zt) + cos(2*pi/25*zt), data=b) 
plot(b$zt, b$walking)
x <- sort(b$zt)
lines(x, predict(lmfit, data.frame(zt=x)), col="red")

enter image description here

You can automatically estimate the period ("wavelength") from the data with a least-squares-fit. Although $\lambda$ is a non-linear parameter and thus cannot be computed directly by lm, you can use the residuals returned by lm to compute the sum of squares and minimize it over $\lambda$:

# function to be minimized
sum_squares <- function(lambda) {
  lmfit <- lm(walking ~ sin(2*pi/lambda*zt) + cos(2*pi/lambda*zt), data=b)
  return(sum(lmfit$residuals^2))
}
lambda <- optimize(sum_squares,c(1,50))$minimum

This computes $\lambda\approx 26.05$, so the guess 25 was not so bad.

cdalitz
  • 2,844
  • 6
  • 13
  • wowee!! thank you so so much!! So would you usually have to calculate the wavelength in R first? (Sorry this is my first time doing this!!) A wavelength of 25 would make sense from a biological view – Jessica Harvey-Carroll Dec 17 '21 at 20:28
  • 1
    @jessica-harvey-carroll I have added code for an automatic estimation of the period from the data. Hope this helps. – cdalitz Dec 18 '21 at 09:01
  • 1
    @JessicaHarvey-Carroll Wouldn't a period of 24 hours (rather than the estimate of 26) make more sense? If so, you're probably better off assuming this a priori rather than trying to estimate the period (as done by @whuber). – Jarle Tufto Dec 18 '21 at 09:59
  • @cdalitz Thanks so much this is really helpful to see!! – Jessica Harvey-Carroll Dec 18 '21 at 15:45
  • @JarleTufto Hmm yes 24 would make more sense biologically. Thats good to know that a priori can be used thanks so much! :) – Jessica Harvey-Carroll Dec 18 '21 at 15:47
  • @JessicaHarvey-Carroll Out of curiosity, I have estimated 95% confidence intervals for the period with the profile-likelihood and the jackknife method, and obtained $(23.8,29.4)$ (profile likelihood) and $(20.6,31.5)$ (jackknife). A period of 24 is thus compatible with the optimal period estimated form the data. – cdalitz Dec 20 '21 at 09:37
13

You might want to do something more flexible and exploratory than fitting sine waves, because biology isn't physics.

Here is a Generalized Additive Model (GAM) fit using a circular spline with three knots (that is, comparable in complexity to a sine wave). We shouldn't use a least squares model due to the strong violation of its assumptions: during each day there are long periods with almost no activity and other periods with a huge (skewed) distribution of activities.

Figure 1

For a more detailed fit, increase the number of knots. Here it is with 12 knots:

Figure 2

You might learn more about these data from this approach. Even if your best fit happens to look sinusoidal, you will have developed the evidence demonstrating it should be so.


I used the R package mgcv to create this fit, employing its built-in circular splines (type "cc"). Ignore its wornings about "non-integer x": this model works well for non-count data, too.

library(mgcv)
# Assemble the data.  Notice the computation of `Time` as hour of the day.
X <- data.frame(zt = zt, Time=zt %% 24, Value=walking)

# Fit the model.  `k` is the number of knots.
fit <- gam(Value ~ s(Time, bs="cc", k=12), X, family="poisson", knots=list(Time=c(0,24)))

# Compute the predicted values for plotting.
Y <- data.frame(zt = seq(0, max(X$zt), length.out=201)[-1])
Y$Time <- Y$zt %% 24
Y$Prediction <- predict(fit, newdata=Y, type="response")

# Plot the data and the fitted values.
with(X, plot(zt, Value, main="Data with Detailed Fit")) 
with(Y, lines(zt, Prediction, lwd=2, col="Blue"))
whuber
  • 281,159
  • 54
  • 637
  • 1,101
  • thanks so much! Could you explain why you went for a GAM with a circular spline? The choice of three knots is relating to the three 'curves' in the data? I completely agree that linear/ least squares model wouldn't be appropriate. I should have mentioned this is data across two days (2*24 hours, day 1= zt0-zt24, day2= zt25-zt48). In this case should knots=list(Time=c(0,24)) be changed to knots=list(Time=c(0,48))? Whilst keeping Time=zt %% 24 so it knows that each 'phase' should be every 24 hours (if that makes sense)! Thanks so much, really appreciate the advice – Jessica Harvey-Carroll Dec 18 '21 at 16:00
  • 2
    Frankly, I chose the GAM because the `mgcv` implementation supports circular splines (as I learned from searching our site!), which obviated any need to program them myself. This implementation also supports GLMs and it permits conducting hypothesis tests. One could also use `glm` with any circular spline basis--likely with nearly the same (or identical) results. Specifying `Time=c(0,24)` tells `bs` that the period is 24 hours; if you change `24` to `48` you won't get a periodic fit. Experiment! – whuber Dec 18 '21 at 17:38
  • 2
    Can I encourage `family = "quasipoisson"` rather than `"poisson"` ? (won't matter to predictions, but will suppress the warning message *and* give more sensible confidence intervals et.) – Ben Bolker Dec 18 '21 at 22:04
  • @Ben Thank you for the suggestion! – whuber Dec 18 '21 at 22:04
  • 1
    @whuber thanks a million for explaining and providing such a comprehensible example. I hadn't heard of splines ect. before so this is great to know :) – Jessica Harvey-Carroll Dec 18 '21 at 22:10