3

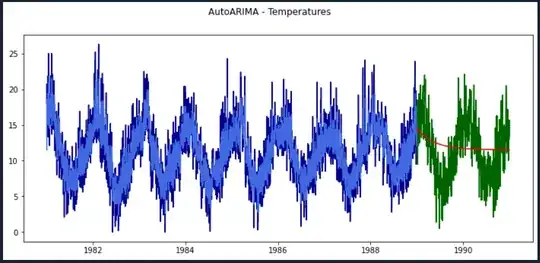
I am trying to implement a pmdarima AutoARIMA estimation exercise for learning reasons. Observation is that, selected model fits the train data quite well, however it performs poorly on test data, at a glance. Dataset is daily temperatures from 1981.01.01 to 1990.12.31 with strong cycle behaviour. Best model found by pmdarima.AutoARIMA is ARIMA(1,0,3)(0,0,0)[0].

I am not sure if the model should perform better on test data or results cannot be improved further for this dataset.

My question is, why the same model performs so differently on train and test data despite that they have similar properties?

Thank you very much.

import matplotlib.pyplot as plt
import pandas as pd
import pmdarima as pm
from sktime.forecasting.model_selection import temporal_train_test_split
from data_preparation import data_preparation

y = data_preparation('D:/Stat/dataset/temperatures.csv', 'Date', 'Temp', 'D')
y_train, y_test = temporal_train_test_split(y, train_size = 0.8)
forecaster = pm.auto_arima(y_train, trace = True)
fitted = forecaster.predict_in_sample()
forecast = forecaster.predict(len(y_test))
fitted = pd.Series(fitted, index = pd.date_range(start = y_train.index[0], periods = len(y_train) + 1, freq='D', closed='right'))
forecast = pd.Series(forecast, index = pd.date_range(start = y_test.index[0], periods = len(y_test) + 1, freq='D', closed='right'))

figure = plt.figure(figsize=(12, 5))
figure.suptitle("AutoARIMA - Temperatures")
new_plot_1 = figure.add_subplot(111)
new_plot_1.plot(y_train.index, y_train.values, 'darkblue')
new_plot_1.plot(y_test.index, y_test.values, 'darkgreen')
new_plot_1.plot(fitted, 'royalblue')
new_plot_1.plot(forecast, 'red')
enter image description here

Richard Hardy
  • 54,375
  • 10
  • 95
  • 219
EEEE77
  • 59
  • 4
  • 1
    I notice that you didn't tell it the length of the seasonal cycle... in R, at any rate, without that, it won't fit one. What you are seeing in the fitted period is the results of something that predicts next period mostly based on the last few, loosely writing, so naturally isn't far off in a 52-week pattern (try plotting "next period = this period" and you'll see that fits not too horribly too.) The predicted period predicts on the basis of the last few periods, which is just the last part of 1988, so can't capture the seasonal pattern, because it's always the same periods. – jbowman Dec 08 '21 at 02:43
  • 1
    I have some comments which you may find relevant. You will find them under Stephan Kolassa's answer. – Richard Hardy Dec 08 '21 at 15:39
  • Thank you very much. – EEEE77 Dec 09 '21 at 09:51

1 Answers1

2

As jbowman notes, you are not telling auto_arima that these are seasonal data with cycle length (about 365). auto_arima does not automatically detect season cycle length, which would be very hard, and possibly impossible if you have . See also here. So tell your code about the seasonality, e.g., by setting m=365 and seasonal=True.

However, even then auto_arima may not pick up on the seasonality. This is a well-known weakness of ARIMA for seasonality with long periods. You can in principle force it to use seasonality, e.g., by setting D=1 to force seasonal differencing. Note that this is not the only way to make ARIMA work with seasonality: you could also try to enforce SARIMA components, like SAR(P). Unfortunately, I do not think that auto_arima allows you to fix the SARIMA orders, or specify minimum SARIMA orders. (At least the default value of start_P=1 will start out with an SAR(1) component.)

Finally, a better approach especially for highly regular seasonality as here would likely be Fourier terms to model seasonality in ARIMA models.

Stephan Kolassa
  • 95,027
  • 13
  • 197
  • 357
  • Thank you sir. Actually, what I am also curious about is that why a model performs generally much better on any training set than test set, regardless the attributes of the dataset (lets say it shows exactly the same properties on the full timeline). Maybe beacause in sample prediction means a one-step prediction on training set and an out of sample prediction means a multi-step prediction on test set? Thank you. – EEEE77 Dec 08 '21 at 09:02
  • 1
    That is a good question, and a big one. In the present case, the problem simply is that the obvious seasonality is not forecasted. But even if you used, e.g., Fourier terms and ARIMA errors, the out-of-sample predictions will likely be worse than the in-sample fits. This is a general observation in forecasting (https://otexts.com/fpp3/accuracy.html). Reasons might include overfitting, or slow but omnipresent drift in the data generating process, and unmodeled (weak) drivers. – Stephan Kolassa Dec 08 '21 at 09:10
  • 2
    Why force seasonal differencing on a series that clearly does not have a seasonal unit root? The suggestion and its wording (*force to use seasonality*) may mislead one into thinking that seasonal differencing is *the* way to deal with seasonality. If one were to force anything in a SARIMA model for this data, it could perhaps be a SAR(1) term, not the seasonal differencing term. – Richard Hardy Dec 08 '21 at 10:15
  • @RichardHardy: good point, I agree. – Stephan Kolassa Dec 08 '21 at 11:07
  • My point is that your penultimate sentence may mislead the readers. I would rather delete it or if not then at least include appropriate qualifications and change the wording. – Richard Hardy Dec 08 '21 at 12:47
  • @RichardHardy: how do you like my edit? I'm not an expert in `pmdarima`, but the documentation does not look like one could force SAR(P). Forcing seasonal differencing is possible, in contrast. – Stephan Kolassa Dec 08 '21 at 14:32
  • Let me try once more: I think seasonal differencing should only be used when a time series has a seasonal unit root. Mentioning seasonal differencing casually as the first technique of seasonal adjustment without a proper warning may mislead the readers into thinking that it should be the first thing they try. I think that is the problematic part of your answer. – Richard Hardy Dec 08 '21 at 14:57
  • @RichardHardy: yes, I do see your point. My point is that seasonal differencing can easily be enforced, whereas other methods require a lot more work, and yes, I do see this as a point in favor of seasonal differencing. Also, I am not quite that afraid of it. Do you have a link or something on what can go wrong with it, worse than with an SAR(P)? Finally, I do note that in this case, the best course of action is likely to include Fourier terms. Do you think SAR(P) or something else should be preferred over this? – Stephan Kolassa Dec 08 '21 at 15:14
  • I think Fourier should be great, SAR(1) fine while differencing not good. The latter because we do not see 365 (or 52 for weekly, or whatever) random walks in the data. If you simulate 365 alternating random walks, graph them and compare to the OPs graph, you would see how different a picture you get. The point forecasts may be OK on average (though inefficiently estimated, so generally less accurate), but the prediction intervals would differ wildly from ones generated from Fourier. I just do not see much use in deliberately using a model that is clearly quite different from the DGP. – Richard Hardy Dec 08 '21 at 15:29
  • And I noticed just now that the variable being modelled is temperature. How likely do you think it is that a temperature series is generated by 365 random walks?.. – Richard Hardy Dec 08 '21 at 15:32
  • @RichardHardy: it sounds like we are in agreement. If not, perhaps you would like to post an alternative answer? – Stephan Kolassa Dec 08 '21 at 15:35