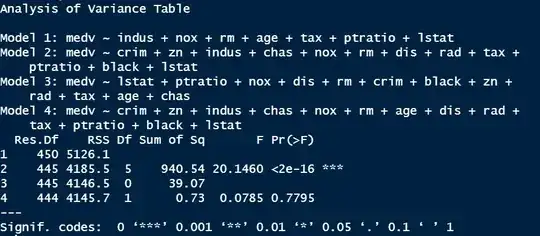
Following, I am not sure of how to interpret this anova output. Model 1,2,3 are all nested in model 4, model 1 is also nested in model 2 but not model 3 because indus is not in model 3 and similarly indus is in model 2 but not in model 3. Model 1 has 7 independent variables, both model 2 and 3 have 12 independent variables while model 4 has 13 independent variables. I am aware that anova makes statistical sense for nested lm objects. Upon using AIC, I realized model 3 is better but how do I know that model 3 is better from this anova output especially that the F value and P value for model 3 is missing? data(Boston) from library("MASS") in R.

Asked
Active
Viewed 21 times
1
holala
- 111
- 2