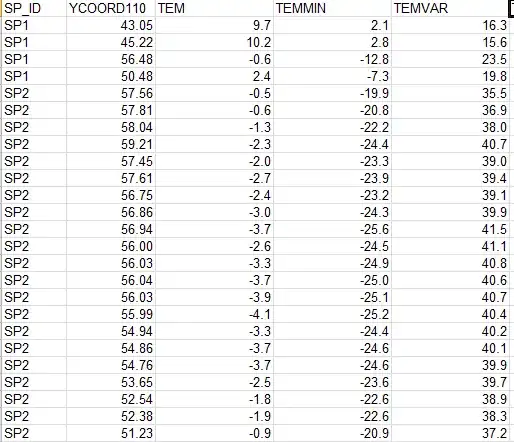
In this table inspired by 3Blue1Brown
I can read off a conditional probability by dividing a cell value by the total in the row or column.
For example the probability of a person being shy given that they are a librarian is 4/10
Is it possible to construct a table or graphic to illustrate the Super Bowl answer here that is
the probability of the Kansas City Chiefs making the playoffs this season is about 72% and the probability of them winning Super Bowl LVI at the end of the season is about 5%, then (since they must make the playoffs to progress to the Super Bowl) you can say
"the probability of the Kansas City Chiefs winning Super Bowl LVI given that they make the playoffs is about 7%"

