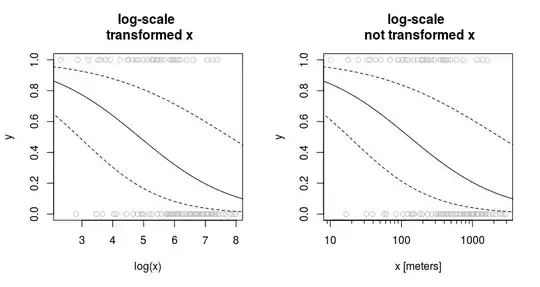
I have a binomial glm modelling the probability of the occurrence of otter roadkill hotspots. My data were not normally distributed therefore to adhere to model assumptions I log transformed all of my variables in R.
The scale of the x-axis on my model prediction graphs are therefore logged. I have a graph looking at the association between roadkill hotspots and distance to nearest road-river crossing. In my model reporting, I have said 'At locations 5 or more metres from a road-river crossing, hotspots were very unlikely to occur.' I would like to know that the value 5 is unlogged, and add this to my figure caption. 5 metres is a tiny distance and in real life and based off of my data this is more likely to be say something like 750m.
Please could anyone tell me how I could find out what this value is unlogged?! To transform the data I just did log(dframe$rivercrossing). Have added my graph for context which has the logged scale.
I can't seem to find any answers on this, I'm stumped! Any help would be massively appreciated. Thanks!

