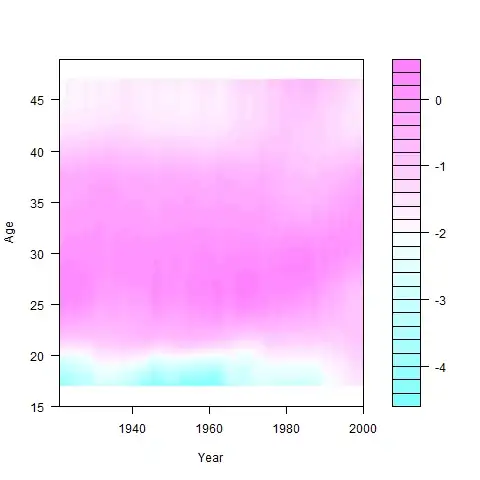
I'm trying to fit a functional demographic model (fdm) to fertility rates using the demography package in R. When I've plotted the residuals using filled.contour, it seems that residuals persist in the lowest age interval over the period.
Since residuals should normally be random, is it normal that the residuals are behaving like this in this case or does it mean my model is underestimating fertility rate in this age group? Or am I simply misinterpreting the graph? Note that I've also tried the adelaid.R codes for Australian fertility given by Prof. Rob Hyndman, and it's same outcome.
Here is the code:
library(demography)
library(addb)
ausfert <- extract.years(aus.fert, years = 1921:2000)
ausf.sm <- smooth.demogdata(ausfert)
ausf.fit <- fdm(ausf.sm,order = 3, method = "classical")
plot(residuals(ausf.fit), type = "filled.contour")