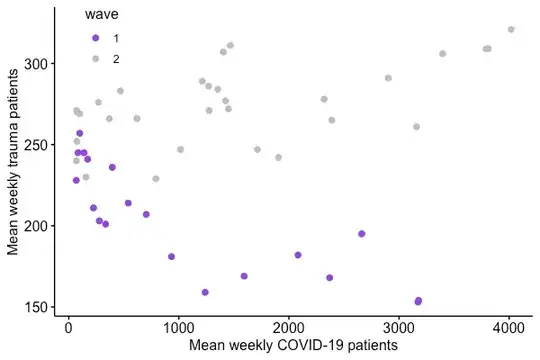
I'm trying to assess the impact of the UK government's differing approach to managing COVID-19 on healthcare outcomes. For example, I can consider weekly patients presenting with COVID-19, and weekly patients presenting following major trauma - clearly in this case there is a difference in the pattern of presentations, with a strong negative correlation during the first "wave" and a weaker positive correlation in the second:
In order to demonstrate that there is a difference between the two distributions, I can show that the correlation coefficients are different for each wave:
weekly_data %>%
  group_by(wave) %>%
  rstatix::cor_test(trauma, covid, method = "pearson", use = "complete.obs")

# # A tibble: 2 × 9
#   wave  var1   var2     cor statistic         p conf.low conf.high method
#   <fct> <chr>  <chr>  <dbl>     <dbl>     <dbl>    <dbl>     <dbl> <chr>
# 1 1     trauma covid  -0.81     -5.77 0.0000227   -0.926    -0.570 Pearson
# 2 2     trauma covid   0.58      3.77 0.000775     0.278     0.778 Pearson
and subsequently use {cocor} as suggested in this answer to compare the two (treating them as independent groups):
cocor::cocor.indep.groups(r1.jk=-0.81, r2.hm=+0.58,
                   n1=22, n2=30,
                   alternative="two.sided", alpha=0.05, conf.level=0.95, null.value=0)
Is this however a statistically rigorous thing to do? I could instead model trauma as a linear model on covid and wave - would I instead report the interaction term between covid and wave, as (I think) this answer was suggesting regarding moderation and this answer regarding interactions and correlations?
summary(lm(trauma ~ covid*wave, data = weekly_data))

# ...
#               Estimate Std. Error t value Pr(>|t|)
# (Intercept) 228.888354   6.547593  34.958  < 2e-16 ***
# covid        -0.024666   0.004333  -5.693 8.91e-07 ***
# wave2        28.238233   8.751896   3.227  0.00234 **
# covid:wave2   0.036196   0.005289   6.843 1.74e-08 ***
Any advice on what's the most "proper" way to approach this would be much appreciated.
