3

I am trying to match the results from using CausalImpact with those from using BSTS for a custom model. I followed exactly what the package instruction says but the results completely do not match.

Here I tried a simple local level model. Dataset name: stopcount_trial, Y variable: stopcount, pre-period: 1-79, post-period:80-158.

First, I tried the CausalImpact package.

pre.period <- c(1, 79)
post.period <- c(80, 158)
impactpractice1 <- CausalImpact(stopcount_trial, pre.period, post.period, model.args = list(niter = 1000))
plot(impactpractice1)

And I get this: enter image description here

Here, I tried the BSTS package (but should be the same as CausalImpact)

post.period <- c(80, 158)
post.period.response <- stopcount_final$stopcount[post.period[1] : post.period[2]]
stopcount_final$stopcount[post.period[1] : post.period[2]] <- NA
ss <- AddLocalLevel(list(), stopcount_final$stopcount)
bsts.model <- bsts(stopcount_final$stopcount, ss, niter = 1000)
impact <- CausalImpact(bsts.model = bsts.model,
                       post.period.response = post.period.response)
plot(impact)

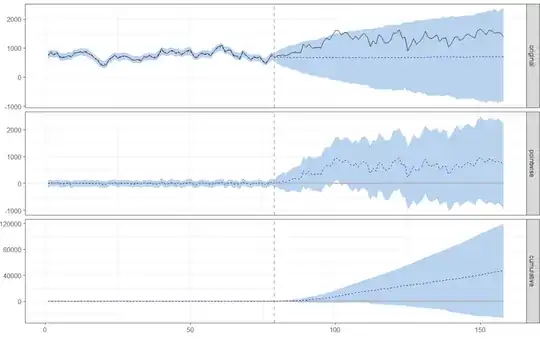
And I get this: enter image description here

The results are supposed to be identical, but they are not. What the heck I am doing wrong here? Please help.
Kang Inkyu
  • 441
  • 1
  • 3
  • 9

1 Answers1

0

Python uses a different approach than R in generating forecasts without an intervention — the former uses the Kalman filter with the aim of maximising the likelihood function observed across the time series, while the latter relies more on a Bayesian approach that emphasises user prior knowledge. The details are described in the pycausalimpact documentation.

Therefore, it is not surprising that different results can be yielded among the two. In the documentation, it is notable that they recommend setting the prior as None. In your case, doing so might see the obtained results resemble that obtained by BSTS more closely. However, that depends on the type of data you are working with and the appropriate assumption for the prior (i.e. your prior beliefs about the distribution of a set of data).

Michael Grogan
  • 1,435
  • 1
  • 8
  • 11
  • Thank you very much for your reply. I actually applied both packages (BSTS and CausalImpact) in R, not Python. I did not customize anything related to prior, I just followed the defaults. Still, the graphs look very different and I am confused. Could you please elaborate a little bit more on this? – Kang Inkyu Oct 02 '21 at 14:58
  • 1
    It seems that the forecast intervals for BSTS are a lot wider than that of CausalImpact. Without knowing in detail what type of data you are working with, it is impossible for me to say why. – Michael Grogan Oct 02 '21 at 23:20
  • The data is basically weekly, large count data of police stop (which I treat as a continuous variable). To be honest neither of the results from CausalImpact nor BSTS make sense to me. In the results from CausalImpact, the historical fit is poor (I thought the default model had local level component and now very confused). In the results from BSTS, as you mentioned, the CI rapidly gets wider which also confuses me (shouldn't the width of CI remain the same throughout the post-intervention period,as in the results from CausalImpact? Please help me out with this!! – Kang Inkyu Oct 03 '21 at 16:38
  • I'm sorry, but I wouldn't be able to diagnose from the limited details here. Yes, the confidence intervals seem to be a lot wider for BSTS, but I cannot determine why from the information provided. – Michael Grogan Oct 04 '21 at 11:24