0

I have a panel dataset which I have fit a fixed-effects model to using plm() in R:

# Sample panel data
ID, year, progenyMean, damMean
1, 1, 70, 69
1, 2, 68, 69
1, 3, 72, 72
1, 4, 69, 68
2, 1, 76, 75
2, 2, 73, 80
3, 1, 72, 74
3, 2, 75, 67
3, 3, 71, 69

# Fixed Effects Model in plm
fixed <- plm(progenyMean ~ damMean, data, model= "within", index = c("ID","year"))

I have plotted progenyMean vs damMean with the fixed effects regression line in blue: enter image description here
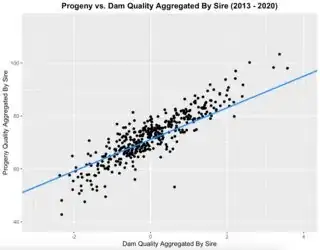
There are several data points for every unique ID, so it's possible for an ID to have points both above and below the regression line.

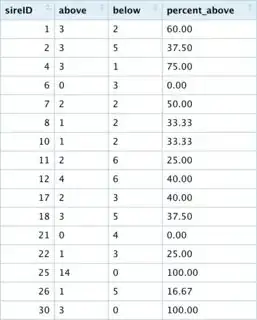
I have identified the data points above/below the regression line and I want to rank the ID's according to them being above the regression line. I created a table where each row is a unique ID and there are two columns, above and below which count the number of data points above/below the regression line for that ID. The last column percent_above is the percentage of each ID's data points that are above the line.

enter image description here

My question is thus: Is there a way to rank these ID's in terms of being above the regression line? There are 2 possibilities I have considered:

  1. Rank ID's according to the proportion of their data points above the regression line. The problem here is that certain ID's with only 3 observations total (all above the line) will rank higher than an ID with 13 observations above the line and 1 observation below the line.
  2. Rank ID's according to the number of observations above the line. The problem here is that an ID with 7 points above and 4 below will rank higher than an ID with all 5 data points above the line.

If there is another way that I have not considered please let me know.
1 Answers1

1

The underlying issue here is that samples with few data points have more uncertainty in the estimation of true proportion above the line. You could use a confidence interval to account for this uncertainty. For each sample, calculate the proportion of samples above the line, and also calculate a confidence interval around this proportion (the prop.test() function in R will do this). Now you can rank samples by the lower bound of the confidence interval - this will highly rank samples that have a lot of evidence for a high proportion, but will not rank samples with very little evidence for a high proportion as highly. This is one measure that will respect both the magnitude of the proportion as well as the amount evidence supporting it - basically, it will find the highest proportions that you are confident in.

Nuclear Hoagie
  • 5,553
  • 16
  • 24
  • This sounds very interesting. In this case, what would I be inputting to the `prop.test()` function? Would I run this for every unique `ID`? – codemachino Aug 27 '21 at 15:36
  • @codemachino prop.test() requires two inputs, the number of successes and the number of trials. From your last table of Above/Below counts, you'd run propOut = prop.test(Above, (Above+Below)) on each line, and get the lower CI bound from propOut$conf.int[1]. – Nuclear Hoagie Aug 27 '21 at 15:42
  • this seems to give a warning message "Chi-squared approximation may be incorrect" which is apparently because one of the expected values in the chi-squared is less than 5. Is there another way around this? I'm very interested in using this method you've discussed. – codemachino Aug 27 '21 at 15:59
  • @codemachino Yes, the chi-squared test underlying prop.test becomes a poor approximation if you have few counts (rule of thumb is <5 expected counts). You can use an exact test for cases with small N instead, although not with prop.test() directly - see https://stats.stackexchange.com/questions/155523/r-prop-test-chi-squared-approximation-may-be-incorrect – Nuclear Hoagie Aug 27 '21 at 16:04
  • I'm still struggling with the code here unfortunately. I used the `fisher.test()` as in the post you linked, but I think the table I'm using is too large (150 rows). Here's a link to a new post I made: https://stats.stackexchange.com/questions/541742/ranking-subjects-causes-prop-test-and-fisher-test-errors – codemachino Aug 28 '21 at 11:48
  • I have performed an exact binomial test on every `ID` using `binomial_test – codemachino Aug 31 '21 at 12:06