2

I’m new to statistics but I’m performing a systematic review into exercise and alcohol intake.

One of the papers uses a zero inflated count regression model to report the alcohol consumption per day.

Is there a way to convert this back to frequency counts?? Does it make sense to do so since a model is technically not the actual values?

The article: Results of interest at table 2 and 3: https://www.ncbi.nlm.nih.gov/pmc/articles/PMC4648239/#!po=0.694444
JoshuaDosh
  • 21
  • 2

1 Answers1

1

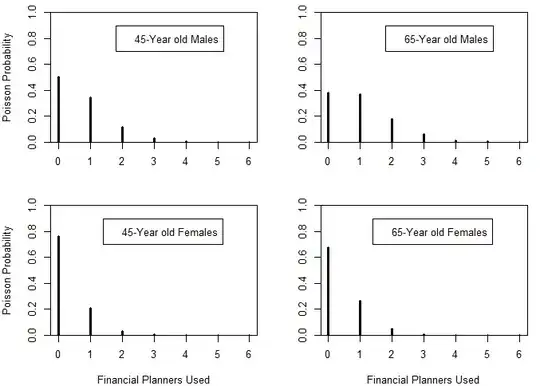
Sure, just plug the values into the probability function and graph. Here is a picture from Ch. 14 of "Understanding Regression Analysis: A Conditional Distribution Approach." It concerns regular Poisson, but the same techniques can easily be used for negative binomial, zero inflated, etc. In the graph, effects on the response frequencies of age, gender, and their possible interaction, all are indicated. Any other $X$ variables can be set to a common value (mean or mode) in such a graph.

Incidentally, regression is a model for the actual values.

enter image description here

BigBendRegion
  • 4,593
  • 12
  • 22
  • It's difficult to reconcile your plots, which show "probability," with your last comment, "regression is a model for the actual values," because probabilities are always theoretical and are never observed. Indeed, a Poisson regression models *expected* values, not actual values. – whuber Aug 21 '21 at 21:39
  • The model is $p(y|X=x)$, which tells you about how the actual values behave. That's the way maximum likelihood (and Bayes) works. The expected value is a corollary. – BigBendRegion Aug 22 '21 at 13:26
  • Is it also possible to get any variances at all like SD? – JoshuaDosh Aug 24 '21 at 17:28
  • Of course; just use the usual pdf formula with the estimated $p(y|x)$. You get a different variance for every $x$. – BigBendRegion Aug 24 '21 at 19:47