2

I would like to compare two methods on qualitative and paired data.

To summarize my study for you (it's for an internship), I have activity values ​​that were measured on 13 sites, for 12 species of bats (some species are not found on all sites).

These activity values ​​are then organized according to 4 levels: weak, medium, strong and very strong, by two different methods. I would like to know if these methods give significantly different activity levels, and if so, which method gives higher activity levels in general?

Then I want to compare these methods on smaller samples, such as groups of species or just by specie (so with only a few samples). I think method 1 will sometimes give higher levels than method 2 depending on the species group formed, and vice versa.

Here is an example from my data: (I have 132 samples in total)

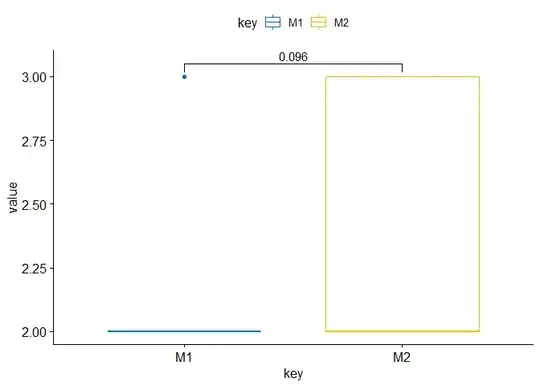
On M1 and M2 you have the activity levels : 1 = weak, 2 = medium, 3 = strong and 4 = very strong enter image description here

What test could I perform on R to compare these methods and tell which one produces higher activity levels? Also, I would like to present my results in a fairly visual way, with graphics. What is possible to do?

I apologize if there are any mistakes, english is not my native language. Also I'm new to this website !

Kuro
  • 21
  • 1
  • 1
    Your data are rankings. They are ordinal, hence categorical quantitative, not qualitative, values. The most natural to use would be paired Wilcoxon test. – ttnphns Jun 30 '21 at 10:08
  • Welcome to stackexchange. If the answer below solved your problem, please consider to [accept it](https://meta.stackexchange.com/questions/5234/how-does-accepting-an-answer-work). – ava Jul 12 '21 at 09:16

1 Answers1

0

Here a R solution with a Wilcoxon test and a figure example:

# library
library(tidyverse)
library(ggpubr)

# get data
sample= c(1:30)
M1=c(3,2,2,2,2,2,2,2,2,2,2,2,2,2,2,2,2,2,2,2,2,2,2,3,3,3,3,3,2,2)
M2=c(3,2,3,3,2,2,3,3,3,2,2,3,2,2,2,2,2,2,2,2,2,2,2,3,3,3,3,3,2,2)

data.frame(sample,M1,M2) -> df

# calculate wilcox test
wilcox.test(df$M1,df$M2)
#>  Wilcoxon rank sum test with continuity correction
#> 
#> data:  df$M1 and df$M2
#> W = 360, p-value = 0.09554
#> alternative hypothesis: true location shift is not equal to 0

# prepare data for figure
df %>% 
  gather(key="key",value="value",-sample) -> df

# make figure
my_comparisons <- list( c("M1", "M2"))
ggboxplot(df, x = "key", y = "value",
          color = "key", palette = "jco")+ 
  stat_compare_means(comparisons = my_comparisons) # Add pairwise comparisons p-value

Figure

gung - Reinstate Monica
  • 132,789
  • 81
  • 357
  • 650
ava
  • 120
  • 7