5

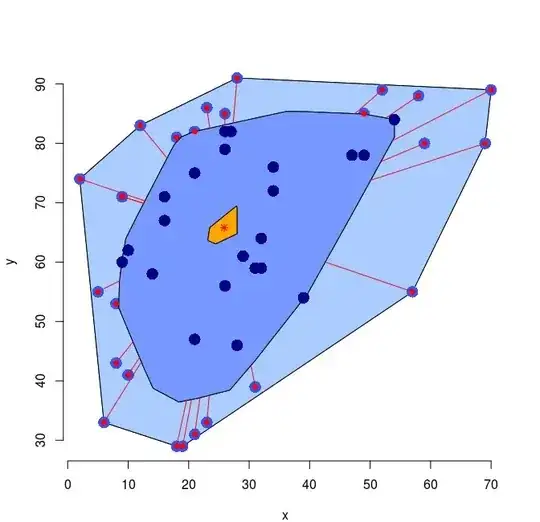
I have been given a set of data points $(x_i,y_i)$. I have to plot a scatter plot and determine if there are any outliers. But I haven't been taught a method to measure which data point is an outlier and which is not. So how can I do it for example in Sage or R? I found by Google that there is at least two tests to do that, Dixon's and Grubbs's test, so which one should I learn in this problem?

x = c(1,34,6,47,10,49,23,32,12,16,29,49,28,8,57,9,31,10,21,26,31,52,21,8,18,5,18, 
     26,27,26,32,2,59,58,19,14,16,9,23,28,34,70,69,54,39,9,21,54,26) 
y = c(47,76,33,78,62,78,33,64,83,67,61,85,46,53,55,71,59,41,82,56,39,89,31,43,29,55, 
     81,82,82,85,59,74,80,88,29,58,71,60,86,91,72,89,80,84,54,71,75,84,79)
gung - Reinstate Monica
  • 132,789
  • 81
  • 357
  • 650
guest
  • 237
  • 1
  • 3
  • 6
  • post some data and you'll get interesting answers. – user603 Mar 25 '13 at 11:27
  • possible duplicate of [Is there a simple way of detecting outliers?](http://stats.stackexchange.com/questions/37865/is-there-a-simple-way-of-detecting-outliers) - if the responses there, or [here](http://stats.stackexchange.com/questions/175/how-should-outliers-be-dealt-with-in-linear-regression-analysis) or [here](http://stats.stackexchange.com/questions/29990/identifying-outliers-for-non-linear-regression) (since you describe the data as $x,y$ pairs), don't answer your question, please be more specific. – Macro Mar 25 '13 at 13:45
  • This question appears to be a special case of the situation addressed in [the question on identifying multivariate outliers](http://stats.stackexchange.com/questions/213/what-is-the-best-way-to-identify-outliers-in-multivariate-data), where a large number of possible solutions are proposed. (However, the two questions are not quite duplicates in my mind, because bivariate data may lend themselves to special techniques that do not generalize to higher dimensions.) – whuber Mar 25 '13 at 13:46
  • @whuber/@gung: as I tried to show, when there are just two variables, one can do things that wouldn't work in higher dimensions. – user603 Mar 25 '13 at 16:17
  • Outliers are really only outliers with respect to some model (even if the model is implicit); points that would be highly unusual under one model are just typical points under another; if you specify some bivariate model it will help you identify the points that don't correspond to it (are highly unlikely, given the model). – Glen_b Mar 25 '13 at 22:59
  • @Glen_b: you are right. But then some models that are more restrictive than others. In higher dimensions, data sparsity stakes the deck in favour of tighter stair-jackets. The arguments for a light handed approach are more compelling in 2D-3D situations. – user603 Mar 26 '13 at 01:09
  • related: on SO: https://stackoverflow.com/questions/41462073/multivariate-outlier-detection-using-r-with-probability | non R superset: https://stats.stackexchange.com/questions/175/how-should-outliers-be-dealt-with-in-linear-regression-analysis – Ciro Santilli 新疆再教育营六四事件法轮功郝海东 Jan 28 '18 at 16:13

1 Answers1

4

Here is how I would approach this. Your problem is bivariate. I would use a bagplot (1), which is a bivariate generalization of the boxplot (and so more of a visual exploratory tool).

In R the code to do this is:

library(aplpack)
bagplot(cbind(x,y),pch=16,cex=2)

yielding the plot below:

bagplot

You can read this plot as you would read a boxplot: the orange central region is the bivariate median, the dark blue region 'the bag' is the bivariate IQR (it contains the 50% most central points) and the light region 'the fence' contains the points that are further away (but not enough that they would be considered outliers.)

There are no data points outside the fence so no clear outliers as far as the bagplot is concerned.

(1) P. J. Rousseeuw, I. Ruts, J. W. Tukey (1999): The bagplot: a bivariate boxplot, The American Statistician, vol. 53, no. 4, 382–387

user603
  • 21,225
  • 3
  • 71
  • 135