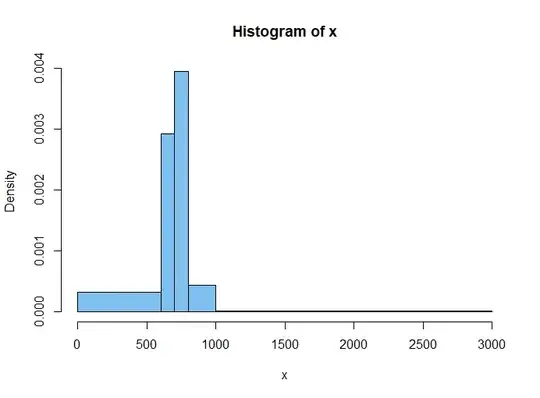
I have a set of data in histogram format with uneven bin sizes, which represents the weight of horses at a certain point in their lifetimes when they are switched from grazing to a racing diet.
$Weight - Headcount\\ 0-600lb: 340,000\\ 600-699lb: 365,000\\ 700-799lb: 494,000\\ 800-899lb: 430,000\\ 900-999lb: 110000\\ 1000-3000lb: 40,000$
I need some kind of estimation of the number of horses which weigh $x\;lb$. My initial thought would be to fit some kind of curve/distribution (lognormal?), but I'd gladly take any suggestions! I can't really fit to the midpoints of each bin, since the first and last bins are fairly highly weighted towards the upper and lower ends of the bands respectively.
It may also be possible that this is a combination of two distributions - male and female horses, which overlap around their means.

