0

I'm trying to compute the symmetry plane of a 3D mesh representing an animal footprint in R.

3D plot animal footprint

I've ran a PCA on the 5755 points that are making up the 3D mesh (see below):

Sample of the 5755 points

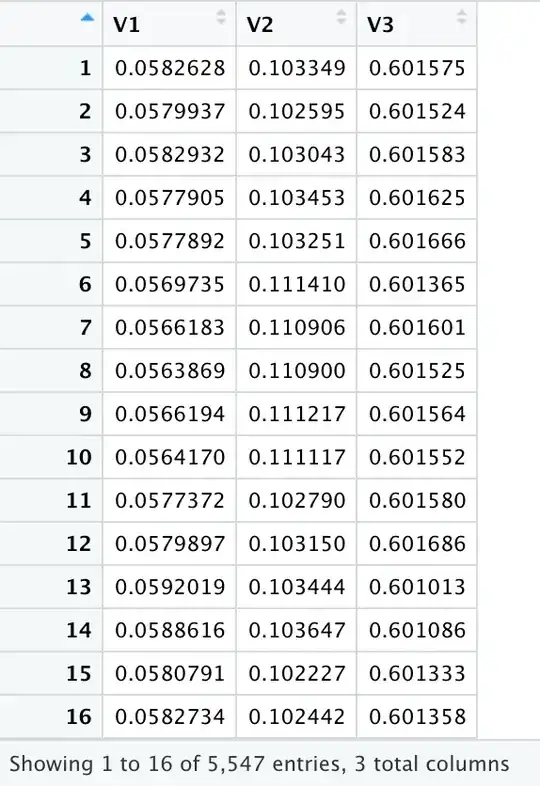
The output of the PCA is the following matrix of variable loadings (i.e., a matrix whose columns contain the eigenvectors):

PCA outputs

The question is how can I now link these Principal Components to the symmetry plan (++=) that passes thought the centre of mass of the 3D mesh (i.e. mean x, mean y and mean z)?

I've read many times the following post but unfortunately I couldn't find a solution to my problem: Fitting a plane to a set of points in 3D using PCA

Here is my script (so far):

library(Rvcg)
library(rgl)

path_ply <- "/Volumes/eTrack/eTrack - Segmented 3D models"

filelist_ply1 <- list.files(path_ply, pattern = ".ply",full.names = TRUE)

i=1

filelist_ply1[i]

#Read 3D mesh (.ply)
Specimen <- vcgPlyRead(filelist_ply1[i], updateNormals = TRUE, 
clean = TRUE)

#Remove unwanted components
Specimen <- vcgIsolated(
Specimen,
facenum = NULL,
diameter = NULL,
split = FALSE,
keep = 1,
silent = FALSE)

X <- t(Specimen$vb[1:3,])

#Demeaning the variables
mean_vec <- colMeans(X)

X_demeaned <- matrix(NA, ncol = 3, nrow = length(X[,1]))
X_demeaned[, 1] <- X[, 1]-mean_vec[1]
X_demeaned[, 2] <- X[, 2]-mean_vec[2]
X_demeaned[, 3] <- X[, 3]-mean_vec[3]

cov.X=cov(X_demeaned)
eigen_vectors <- eigen((cov.X))$vectors
eigen_values  <- eigen((cov.X))$values
eigen_vectors
eigen_values

a <- eigen_vectors[1, 3]
b <- eigen_vectors[2, 3]
c <- eigen_vectors[3, 3]
d <- a * mean_vec[1] + b * mean_vec[2] + c * mean_vec[3]

open3d()
plot3d(X[, 1], X[, 2], X[, 3], type = "p", col = "red", size = 1)
rgl.planes(a, b, c, d, alpha=0.2, color = "#D95F02")
Misius
  • 703
  • 12
  • But the solution is given in the post you linked. You have eigenvectors (you only need the third one $e_3$), you can presumably calculate the mean vector $m$ of your data. So the plane (specified by $a, b, c, d$) is given by $e_3$ and $e_3 \cdot m$ – Misius Jun 15 '21 at 12:50
  • Hi Misius. Thanks for your quick reply! I've tried to follow the instructions in the post that I linked but without success. Here is what I did in R: a – Antoine Marchal Jun 15 '21 at 14:20
  • It works for me. I did something like `plot3d(rnorm(100), rnorm(100), rnorm(100), type = "s", col = "red", size = 1)` and `rgl.planes(a, b, c , d, alpha=0.2, color = "#D95F02")` (with my own defined `d`). Do you have an error? Do you consider that `rgl.planes` can only add planes to the graph so you need to call `plot3d` first? – Misius Jun 15 '21 at 14:54
  • @Misius, yes I did plot my 3D mesh by calling plot3d first. – Antoine Marchal Jun 15 '21 at 16:31
  • Can you please tell what happens when you call this function? I will post my code sample (that works for me) in an answer section, because it is almost impossible to read code here – Misius Jun 15 '21 at 18:08

1 Answers1

0

I have taken the algorithm that was provided in the question that you linked and written a small toy example in R. It is probably not the most efficient solution, but it works on my computer.

library("rgl")

X <- cbind(rnorm(100), rnorm(100), rnorm(100))
#Demeaning the variables
mean_vec <- colMeans(X)

X_demeaned <- matrix(NA, ncol = 3, nrow = 100)
X_demeaned[, 1] <- X[, 1]-mean_vec[1]
X_demeaned[, 2] <- X[, 2]-mean_vec[2]
X_demeaned[, 3] <- X[, 3]-mean_vec[3]

cov.X=cov(X_demeaned)
eigen_vectors <- eigen((cov.X))$vectors
eigen_values  <- eigen((cov.X))$values
eigen_vectors
eigen_values

a <- eigen_vectors[1, 3]
b <- eigen_vectors[2, 3]
c <- eigen_vectors[3, 3]
d <- a * mean_vec[1] + b * mean_vec[2] + c * mean_vec[3]

open3d()
plot3d(X[, 1], X[, 2], X[, 3], type = "s", col = "red", size = 1)
rgl.planes(a, b, c, d, alpha=0.2, color = "#D95F02")
Misius
  • 703
  • 12
  • @Missius, thanks for your toy script that also works on my computer. But unfortunately, it is still not working when I replace your input data by my 3D coordinates. Using the rgl.planes() doesn't give an error message but it is also not drawing any planes on the 3D plot. – Antoine Marchal Jun 16 '21 at 08:29
  • Then the problem is not in the algorithm. You can add the script that you are using to the question, maybe there is an error there that you just do not see... – Misius Jun 16 '21 at 10:47
  • script posted. Thanks for all your help. Hopefully we find a solution soon. – Antoine Marchal Jun 16 '21 at 12:41