7

I have a load of time-depth data collected from some birds on a field trip.

I am trying to classify diving behaviour by setting a depth threshold past which a dive can be said to have occurred. However, there is background noise in the data that varies within and between birds, making determining a fixed threshold problematic (as for one bird it will catch mostly dives but for another will catch everything - see image).

Is there a way to transform the data as to 'flatten' this baseline of background noise to say, 0, so that all spikes can be caught by depth values > 0?

I know there are various clustering techniques that could fairly easily clasify dive behaviour here, but the problem with this is that I afterwards have to create a huge data set (for deep learning) from a rolling window of acceleration and depth values, with binary values on the end indicating whether or not a dive has occured within that window, and doing this with a variable threshold will drastically complicate things. (I would ideally like to get to a point where I could just take the depth vector from a given window and run a line of code like int((d_vec > thrshold).any()) to determine if any dives had occured)
depth time-series example

UPDATE:

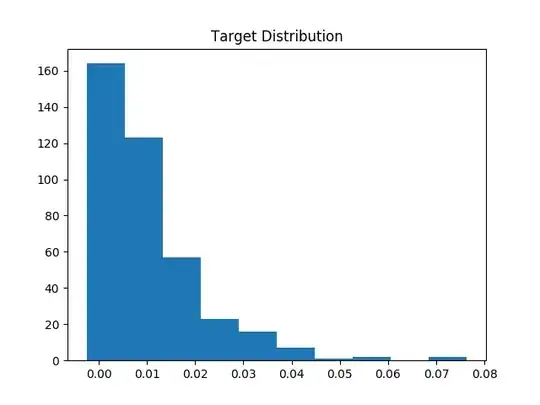
I worked out a satsfactory solution of taking a rolling window of ~30 values and offsetting them by the median of that window (taken to be the 'baseline'). This nicely 'smoothed' my plots while preserving the shape of each dive, but am still all ears for better solutions (or improvements to my code below)...

cat("\rTransforming data...")
k = 30

# take rolling median as baseline for each window
offset = zoo::rollapply(ts_data_d$Depth, width=k, by=k, FUN=median)
offset = rep(offset, each=k)

# match lengths
dif = length(ts_data_d$Depth) - length(offset)
offset = c(offset, rep(tail(offset, 1), dif))

# Zero-offset data
new_series = ts_data_d$Depth - offset
new_series[new_series<0] = 0  # negative depth meaningless
new_series[(length(new_series)-dif):length(new_series)] = 0  # no dives as device removed
ts_data_d$Depth_mod = new_series
enter image description here

LDSwaby
  • 73
  • 4
  • 1
    The first thing I'd consider is finding a sound engineer to consult it. They already seem to have methods that are proven to work for such cases. – Tim Jun 14 '21 at 09:20
  • Why don't you write up your solution as an answer to your question? That's OK on this site, and could be guide to future readers. – EdM Jun 19 '21 at 16:53

2 Answers2

3

This is an example of change-point analysis, for which tools are described for example here and, in the context of loess (a standard approach for smoothing), here. The changepoint package in R provides some potentially useful tools. Note the both the mean and the variance in depth readings change dramatically during a dive, so the tools in that package for evaluating change-points on those bases might help. (I don't have much practical experience with that, however.)

In this case, as a simple approach, you might consider working with the differences between successive depth readings. It looks like those differences are small while the bird is on the surface, but then undergo a biphasic large-magnitude positive/negative change during a dive. The threshold for calling a dive could then be based on the magnitudes of those biphasic changes, with dive depth determined by going back to the original undifferenced data for each dive.

That said, your solution of using a rolling window of 30 is fine if it reliably does what you want. It nicely incorporates your knowledge of the subject matter, as that size of a window seems large enough to smooth out individual dives without being too aggressive in smoothing.

EdM
  • 57,766
  • 7
  • 66
  • 187
  • Hey. The problem with the diff() method is that it limits the no. of points per spike/dive to just 1 or 2 (plunge and following ascent), so you lose a lot of data about the dives themselves. Perfectly fine if detecting a dive is all I want to do, but I may want to do some further analysis downstream, so the ideal method would keep all the shapes of each dive the same but just smooth the baseline. Do you know of any specific functions in the changepoint packge that could help? – LDSwaby Jul 04 '21 at 11:32
  • 1
    @LDSwaby the idea was to use that approach to identify the time period for each dive, then go back to the full data to analyze the details of each drive. – EdM Jul 05 '21 at 14:01
  • Ahhh I seee. Thanks so much! Very helful answer :) – LDSwaby Jul 11 '21 at 12:57
0

Your question will likely get better answers at https://dsp.stackexchange.com/. What you are describing in your update is very close to a median filter. The median filter is part of a larger class of filters called order-statistic filters. Another order-statistic filter you may be interested in is the LULU filter.

From a quick Google search, I found the smooth function, which may be applicable.

mhdadk
  • 2,582
  • 1
  • 4
  • 17